COPPER PRICE AND TREND 2026
COPPER PRICE 2026 ANALYSIS
Copper price analysis for 2026 points to a bullish outlook driven by tight supply, surging demand from green energy (EVs, grid expansion, AI), and fragile mine output, with forecasts generally placing prices in the $10,000-$12,000/tonne range, though some analysts see spikes to $12,500-$15,000/tonne, especially in the first half of the year, due to persistent deficits and strategic stockpiling. Expect continued volatility with potential short-term dips but a strong fundamental trend upward as energy transition needs outpace new supply.
Key Drivers for 2026
Supply Shortages: Mine supply struggles to keep pace with demand, creating structural deficits, notes J.P. Morgan.
Energy Transition Demand: Massive investment in renewables, grid upgrades, and data centers for AI significantly boosts copper demand.
Strategic Stockpiling: Governments and industries may hoard copper, creating artificial tightness and price spikes, suggests Citi.
Fragile Supply Chain: Geopolitical risks and slow development of new mines add to market fragility, says Nasdaq.
Price Forecasts & Ranges
J.P. Morgan: Averages $12,075/ton for 2026, peaking at $12,500/ton in Q2.
Goldman Sachs: Sees prices averaging $10,710/ton in H1 2026, range of $10,000-$11,000/ton.
General Consensus: Broad range of $10,000-$12,000/ton, with some outliers bullishly targeting $15,000/ton.
Risks & Nuances
Slower Chinese Demand: Weaker economic activity in China could temper price rises.
Macro Slowdown: A broader global recession would negatively impact forecasts.
Supply Recovery: Potential operational improvements at mines could ease tightness mid-year.
In Summary: 2026 is shaping up to be a strong year for copper, defined by demand growth outpacing supply, leading to higher prices, though analysts debate the exact peak and duration.
------
Copper is heading into a structural deficit from 2026 as demand from electrification accelerates faster than new supply, according to BloombergNEF, with geopolitical intervention now the single biggest force shaping metals markets.
In its December report, Transition Metals Outlook 2025, BloombergNEF says copper faces the most acute pressure among transition metals, driven by rapid growth in data centres, grid expansion and electric-vehicle adoption. Energy-transition demand for copper is set to triple by 2045, pushing the market into persistent deficit unless investment and recycling ramp up.
Kwasi Ampofo, head of metals and mining at BloombergNEF, told MINING.COM the imbalance reflects rising demand colliding with slow project delivery. “Copper, platinum and palladium have experienced very slow capacity addition at a time where demand is growing,” he said, calling them the commodities under the greatest near-term pressure.
Supply constraints are already visible. Disruptions in Chile (Quebrada Blanca, El Teniente), Indonesia (Grasberg) and Peru (Las Bambas, Constancia), paired with slow permitting, have tightened the market. BloombergNEF estimates the copper shortfall could reach 19 million tonnes by 2050 without new mines or significant gains in scrap collection.
Short-term price moves
Prices are up 35% so far this year and heading for their largest gain since 2009. While the copper-shortage debate often blurs short-term price moves with long-term fundamentals, Ampofo said BloombergNEF’s outlook is grounded in structural supply-demand trends. Bringing new supply online this decade will require sustained investment to expand existing projects, streamlined permitting and better recycling systems.
That long-term view is increasingly shared by miners. BloombergNEF notes renewed capital spending and consolidation across producers including Anglo American (LON:AAL), BHP (ASX:BHP), Glencore (LON:GLEN), Rio Tinto (ASX:RIO), Vale (NYSE:VALE) and Zijin (HKEX:2899). Ampofo said the surge in mergers and acquisitions signals copper’s growing strategic value, a conclusion the firm’s analysis supports.
The others
While copper dominates near-term concerns, the report highlights diverging paths across other metals.
Aluminum supply remains heavily concentrated in China, which produces half the world’s output. A government cap aimed at curbing emissions has left little room to grow, and BNEF says the ceiling’s constraint on supply could persist unless raised. China’s share declines to 37% by 2050 in the Economic Transition Scenario, while India more than doubles production over the next decade.
Graphite demand rises from 2.7 million tonnes in 2025 to 6.7 million tonnes in 2050, driven by its central role in lithium-ion battery anodes. The market is expected to slip into technical deficit in 2032 as secondary supply from retired batteries fails to match the slowdown in primary-supply growth.
Lithium supply, by contrast, continues to grow. Total capacity could hit 4.4 million tonnes of lithium carbonate equivalent by 2035, up from 1.5 million tonnes in 2025, supported by new South American and African projects, maturing direct-extraction technologies and rising secondary supply. Prices remain low after falling from a 2022 peak of $80,000 per tonne, though recent disruptions and subsidy reductions have triggered a modest recovery.
Manganese supply remains broadly aligned with demand through 2050 thanks to stable ore availability and dominant use in steelmaking, which accounts for 97% of consumption. Short-term risks persist due to logistics challenges in South Africa and Gabon’s planned 2029 export ban.
Cobalt prices have rebounded after the Democratic Republic of Congo imposed a four-month export ban in February, later replaced with a quota system that caps annual exports at 96,600 tonnes for 2026–27, a 50% cut from 2024 levels. Prices climbed 128% from February to October as the market tightened.
China’s dominance
Despite broad investment in critical-minerals supply chains, China retains dominance across most midstream refining, especially in aluminum, graphite, manganese, cobalt, nickel and rare earths. Europe and the US remain heavily exposed in graphite, manganese, nickel and lithium, while Japan and South Korea rely on diversified imports and recycling.
Geopolitics now underpins many of those strategies. Ampofo said government involvement can unlock capital but also heightens the risk of conflict, and warned that subsidies alone will not resolve supply-chain concentration. Looking ahead, he said price signals in 2026 will be critical, either encouraging new supply or curbing demand through substitution.
The report also underscores the need to decarbonize metals used in clean-energy infrastructure. Steel, aluminum and copper carry the highest embodied emissions, and while solar and wind projects offset those emissions within months of operation, BloombergNEF cautions that slow progress upstream could lengthen the carbon payback period.
-----------
Currently 29/12/2025 - copper price stand at 12,960 USD/MT ,with forecast that it will continue to going up maybe in 2026 we can see the price at 16,000 usd/mt as ceiling while the bottom on year 2026 should be at level- 11,500 : average copper price at 2026 the range mught be 12,500 to 13,500 USD/MT
----------- ADDING-----
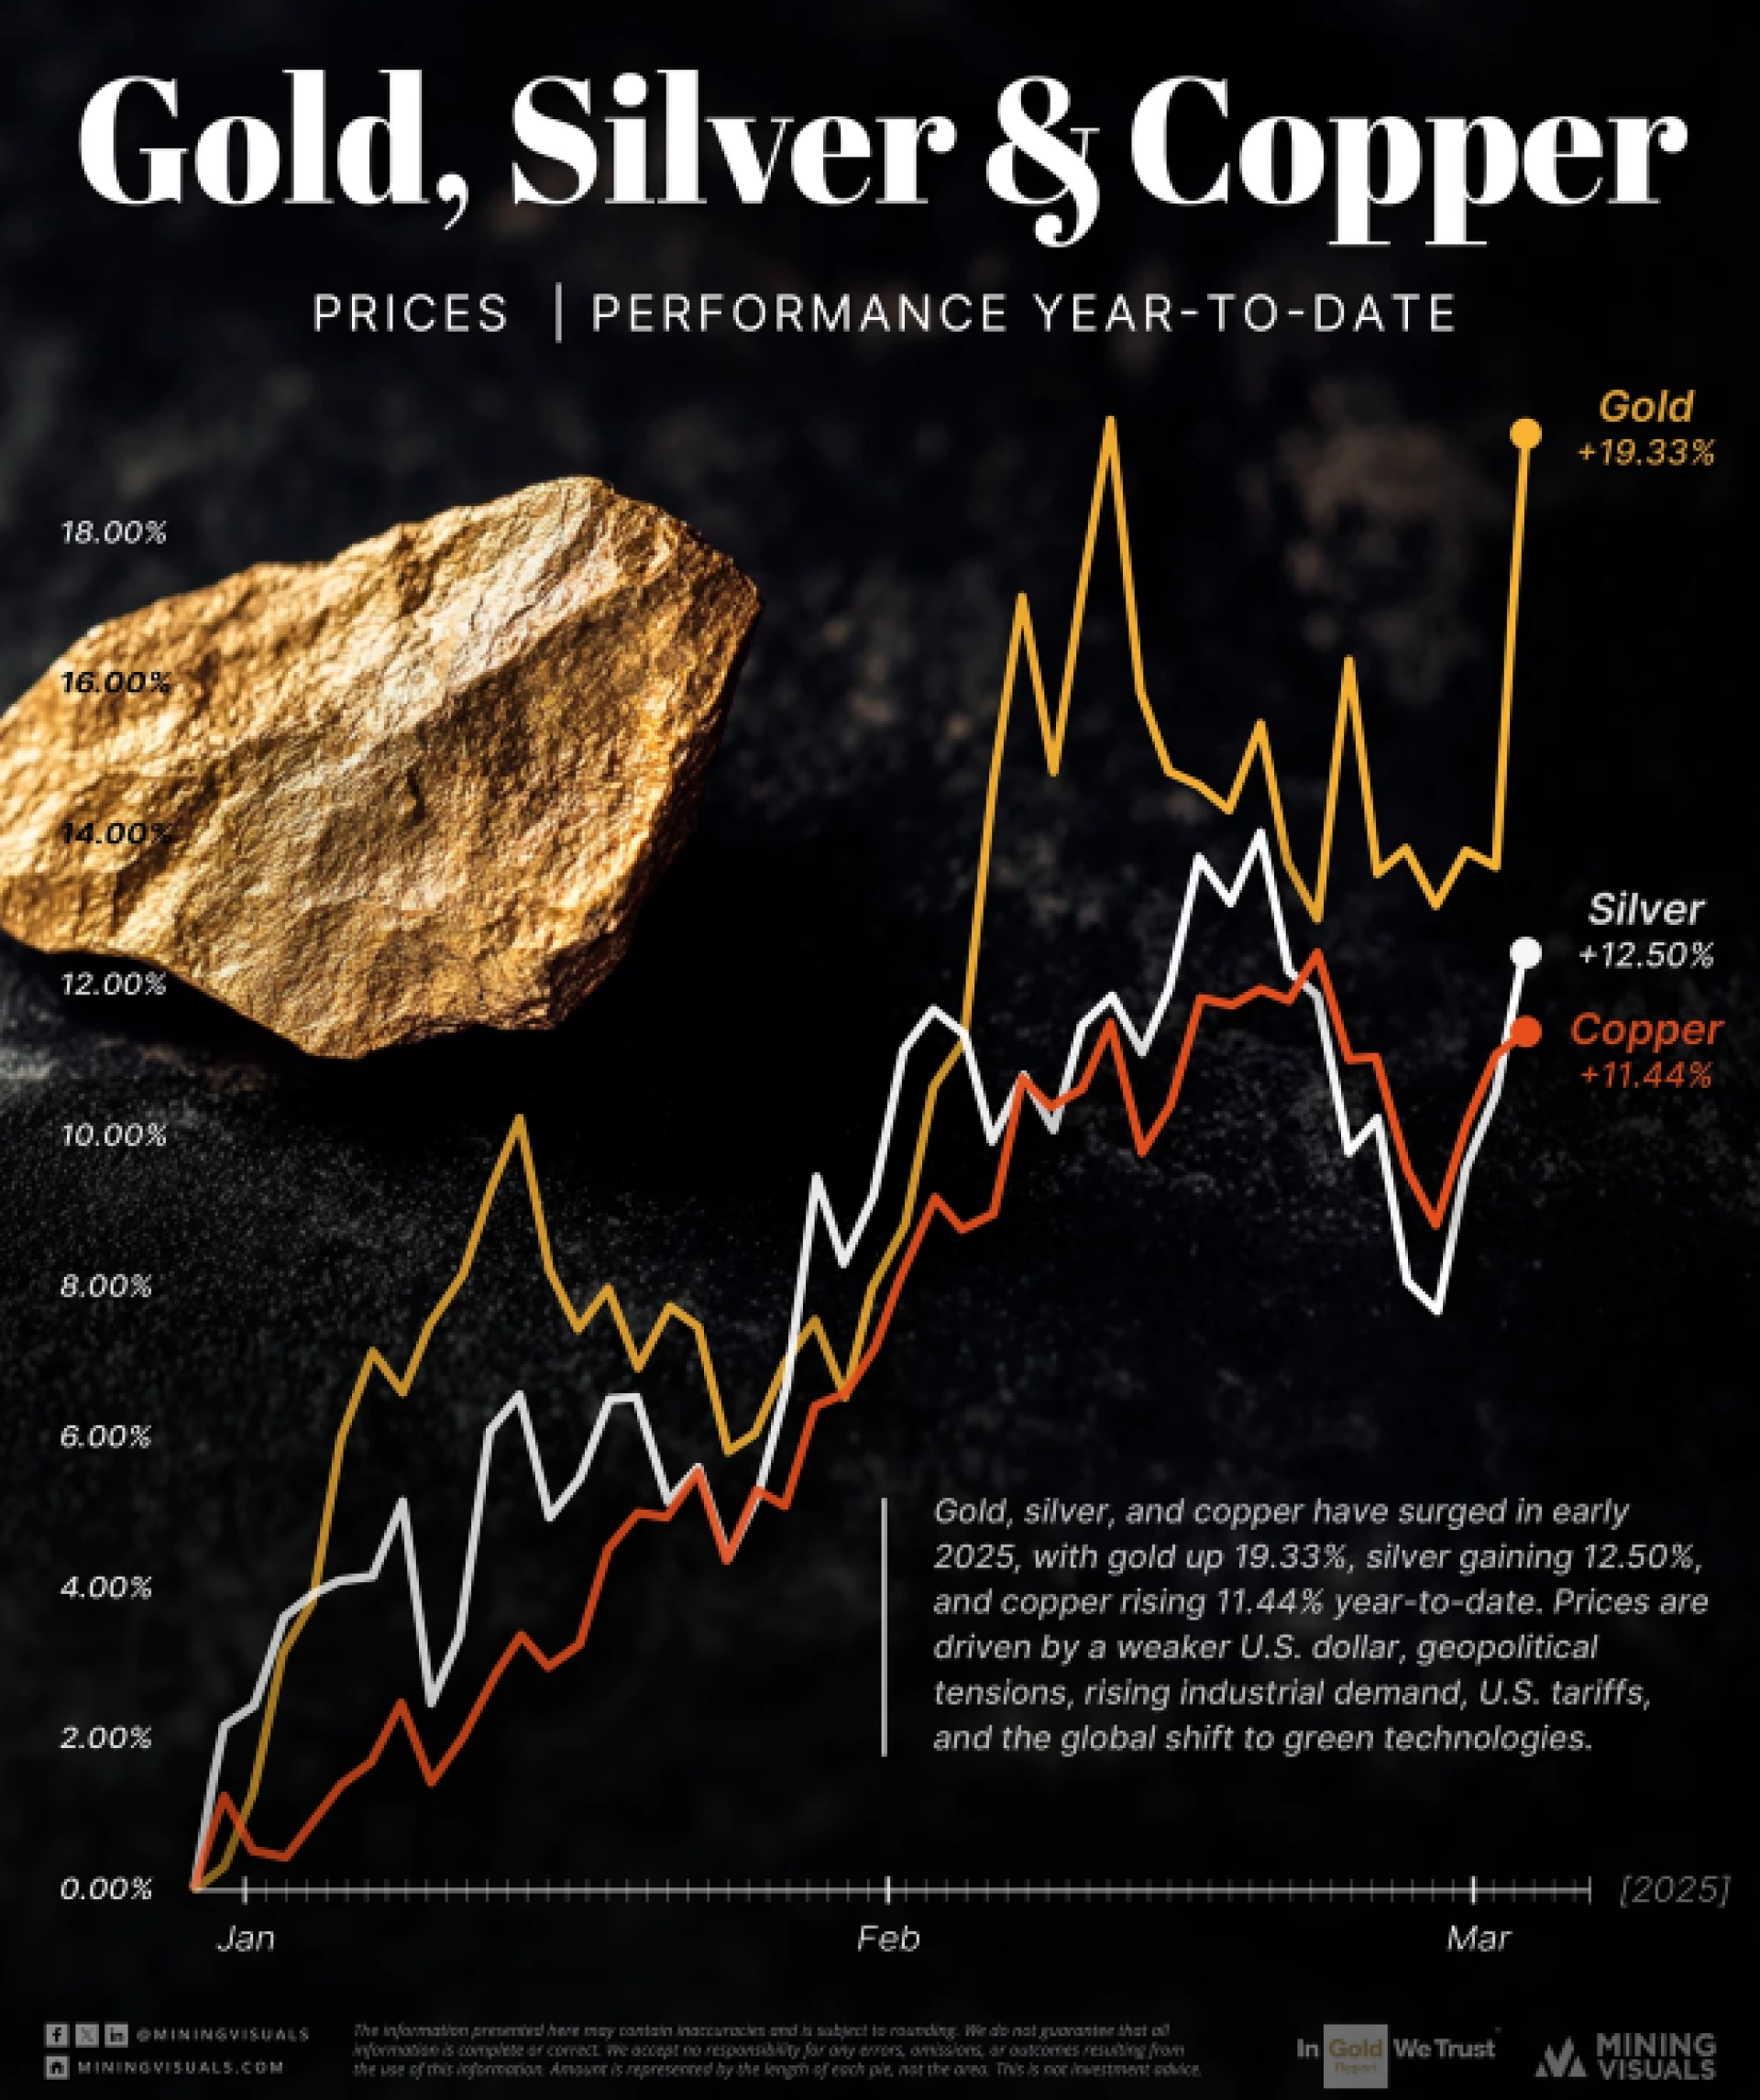
Gold, silver & copper have had a stellar start to 2026, with prices surging across the board.
A confluence of factors is fueling the fire:
Weaker U.S. Dollar: A softer greenback makes dollar-denominated metals more affordable for buyers using other currencies, boosting demand.
Geopolitical Tensions: Uncertainty and instability on the global stage tend to increase the safe-haven appeal of gold and silver.
Rising Industrial Demand: Copper, essential for electrical wiring and infrastructure, is benefiting from continued economic growth and the expanding green technology sector.
U.S. Tariffs: Trade tensions can disrupt supply chains, potentially leading to higher prices for imported metals.
Green Technology Boom: The global shift towards renewable energy and electric vehicles is driving significant demand for copper and silver, key components in these technologies.
While the future of any market is uncertain, the current trends suggest that these metals could continue to shine in the months to come. Investors and industry participants alike will be keeping a close eye on these markets as the year progresses.
------