“Gold prices keep soaring without limits — will they stop at the universe? BY SO OK TRADING”
Last updated: 13 Jan 2026
3991 Views

Gold Price Analysis (2015–2025 Trends and Forecast to 2030)
Historical Gold Prices (USD/oz)
2015 – Average ~1,125 USD/oz → Strong US dollar, Fed begins rate hikes
2016 – Average ~1,275 USD/oz → Brexit, rising global economic risks
2017 – Average ~1,290 USD/oz → Strong equity markets, gold relatively stable
2018 – Average ~1,300 USD/oz → US–China trade war begins, market uncertainty increases
2019 – Average ~1,410 USD/oz → Fed rate cuts, economic risks intensify
2020 – Average ~1,815 USD/oz → COVID-19, US QE policy, surge in safe-haven demand
2021 – Average ~1,825 USD/oz → Inflation swings higher, USD weakens, gold begins to rise
2022 – Average ~1,870 USD/oz → Russia–Ukraine war, commodity prices (oil, gold, metals) surge
2023 – Average ~1,985 USD/oz → Global inflation intensifies, Fed continues rate hikes, geopolitical risks persist
2024 – Average ~2,285 USD/oz → Central banks worldwide significantly increase gold purchases (safe-haven asset)
2025 – Average ~3,900 USD/oz → Second wave of inflation, global central banks accumulate gold, de-dollarization trend
Gold Price Outlook (2026–2030)
2026: Goldman Sachs projects ~4,900 USD/oz; other forecasts range ~3,300–3,900 USD/oz
2027–2028: Continued upward trend, potential to reach ~5,500 USD/oz
2029: Strong demand from central banks and investors, price may reach ~6,000–6,500 USD/oz
2030: Conservative forecast places the peak around ~7,200 USD/oz
Positive Drivers
Fed and other central banks expected to cut interest rates
Inflation and global economic uncertainty
Increased gold purchases by central banks (China, India, Russia)
Geopolitical risks, trade policies, rare earth demand in industry
Risk Factors
Rapid global economic recovery with sustained high interest rates → possible gold price correction
US dollar strength or volatility → downward pressure on gold prices
2026 Price Assessment (Probability-Based)
Average forecast: ~4,700 USD/oz
Range: 4,000–5,000 USD/oz
Scenario probabilities:
Base case (45%): 4,500–4,800 USD/oz
Bullish case (35%): 4,800–5,000 USD/oz
Bearish case (20%): 4,200–4,500 USD/oz
Conclusion
Gold prices are expected to remain on an upward trajectory over the next five years. While 2026 may see short-term corrections, the average price is projected around 4,700 USD/oz, with a ceiling near 5,000 USD/oz and a floor around 4,000 USD/oz. By 2030, gold could reach 6,000–7,000 USD/oz, supported by inflationary pressures, monetary easing, and strong central bank demand. Gold remains a critical safe-haven asset and a strategic tool for portfolio diversification.
Would you like me to also prepare a bilingual Thai–English comparison table so you can use it directly in presentations or export documentation?
Historical Gold Prices (USD/oz)
2015 – Average ~1,125 USD/oz → Strong US dollar, Fed begins rate hikes
2016 – Average ~1,275 USD/oz → Brexit, rising global economic risks
2017 – Average ~1,290 USD/oz → Strong equity markets, gold relatively stable
2018 – Average ~1,300 USD/oz → US–China trade war begins, market uncertainty increases
2019 – Average ~1,410 USD/oz → Fed rate cuts, economic risks intensify
2020 – Average ~1,815 USD/oz → COVID-19, US QE policy, surge in safe-haven demand
2021 – Average ~1,825 USD/oz → Inflation swings higher, USD weakens, gold begins to rise
2022 – Average ~1,870 USD/oz → Russia–Ukraine war, commodity prices (oil, gold, metals) surge
2023 – Average ~1,985 USD/oz → Global inflation intensifies, Fed continues rate hikes, geopolitical risks persist
2024 – Average ~2,285 USD/oz → Central banks worldwide significantly increase gold purchases (safe-haven asset)
2025 – Average ~3,900 USD/oz → Second wave of inflation, global central banks accumulate gold, de-dollarization trend
Gold Price Outlook (2026–2030)
2026: Goldman Sachs projects ~4,900 USD/oz; other forecasts range ~3,300–3,900 USD/oz
2027–2028: Continued upward trend, potential to reach ~5,500 USD/oz
2029: Strong demand from central banks and investors, price may reach ~6,000–6,500 USD/oz
2030: Conservative forecast places the peak around ~7,200 USD/oz
Positive Drivers
Fed and other central banks expected to cut interest rates
Inflation and global economic uncertainty
Increased gold purchases by central banks (China, India, Russia)
Geopolitical risks, trade policies, rare earth demand in industry
Risk Factors
Rapid global economic recovery with sustained high interest rates → possible gold price correction
US dollar strength or volatility → downward pressure on gold prices
2026 Price Assessment (Probability-Based)
Average forecast: ~4,700 USD/oz
Range: 4,000–5,000 USD/oz
Scenario probabilities:
Base case (45%): 4,500–4,800 USD/oz
Bullish case (35%): 4,800–5,000 USD/oz
Bearish case (20%): 4,200–4,500 USD/oz
Conclusion
Gold prices are expected to remain on an upward trajectory over the next five years. While 2026 may see short-term corrections, the average price is projected around 4,700 USD/oz, with a ceiling near 5,000 USD/oz and a floor around 4,000 USD/oz. By 2030, gold could reach 6,000–7,000 USD/oz, supported by inflationary pressures, monetary easing, and strong central bank demand. Gold remains a critical safe-haven asset and a strategic tool for portfolio diversification.
Would you like me to also prepare a bilingual Thai–English comparison table so you can use it directly in presentations or export documentation?


Related Content
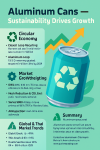
Thailand is entering a new era where aluminium cans are no longer just packaging — they have become symbols of sustainability, innovation, and circular growth.
In 2025, the metal packaging industry is projected to generate over 18 billion THB, with aluminium accounting for 74.22% and aluminium cans leading at 58.48%. Many producers are switching from plastic to aluminium to meet ESG goals and to build a modern, eco-friendly brand image.
If you are looking for Aluminium Coil, Ingot, or Remelt for sustainable packaging or industrial applications that demand international quality standards,
please contact SO OK TRADING today.
20 Feb 2026

Aluminum Sow vs. Remelt Block: Recycling Giants Transforming Global Industry Toward the Net Zero Era
By SO OK TRADING – 18 May 2026
As industries worldwide accelerate toward the Net Zero era, aluminum is no longer just an ordinary raw material. It has become a tangible source of energy driving the Circular Economy forward.
Today, let’s explore the two key players in the recycling world — Aluminum Sow and Remelt Block — the dynamic duo reshaping global industry, from massive smelters to everyday foundries.
Aluminum Sow: The giant of smelting, weighing hundreds to thousands of kilograms. Perfect for large-scale industrial furnaces, offering lower unit costs and efficient bulk transport.
Remelt Block/Ingot: Smaller in size, weighing 5–100 kilograms. Easy to move, quick to melt, and highly flexible — ideal for foundries that require precise temperature control and adaptability.
Together, they are crucial gears in the system, reducing energy consumption by up to 95% compared to primary aluminum production, while also helping industries avoid Europe’s carbon tariffs (CBAM).
Thailand is no exception — we are the hub of aluminum recycling and mid-to-downstream processing in ASEAN, especially in the EEC (Chonburi–Rayong) region, where the EV and clean energy boom is driving demand for Aluminum Sow to new heights.
✨ Aluminum Sow is not just a massive ingot, but a bridge to a green future through the Circular Economy.
SO OK TRADING is ready to be your trusted partner at every step — from sourcing high-quality metals to powering the transition toward a carbon-free world.
18 May 2026

Aluminum Coil for Beverage and Food Packaging: Global Outlook 2027
By SO OK TRADING | 16 September 2026
✨ Introduction
The year 2027 marks a turning point for the global aluminum coil market for beverage and food packaging. While China continues to dominate as the largest producer and exporter, mounting pressures from Carbon Border Adjustment Mechanisms (CBAM), rising demand for recycled content, and expanding production capacity from competitors such as Thailand, India, Japan, Turkey, and Europe are reshaping the industry landscape like never before.
Global buyers are now seeking new alternatives that balance cost, quality, and sustainability. ASEAN producers, particularly UACJ Thailand, stand out with their AFTA tariff advantages and Japanese-level manufacturing standards.
The aluminum packaging market is no longer just about “price.” It has evolved into a matter of sourcing strategy, requiring careful consideration of conversion costs, regional premiums (MJP / Rotterdam), and the growing trend of Green Aluminum, which is rapidly becoming the new global standard.
As a trusted business partner from Thailand, SO OK TRADING provides in-depth insights and global market outlooks to help companies and brands plan their procurement strategies effectively and stay ahead in the new era of the aluminum industry.
SO OK TRADING — FAST • SHARP • RELIABLE
Your true partner in the aluminum packaging industry from Thailand
16 Sept 2026
