Aluminum Packaging 2027: From Lightweight Metal to the Future of Cans — Unlocking the Global Market Where Conversion Cost Defines the Core of Competition SO OK TRADING · July 16, 2026
Aluminum Packaging Industry: Beverage Cans & Food Cans
SO OK TRADING — FAST • SHARP • RELIABLE
Producing aluminum cans is not only about the “metal price.” Conversion Cost (Can Premium) — the cost of producing aluminum sheets and coils for packaging — reflects energy, labor, technology, and the bargaining power of rolling and forming mills. This cost is a key factor shaping the global packaging industry.
Conversion Cost: Real Market Figures
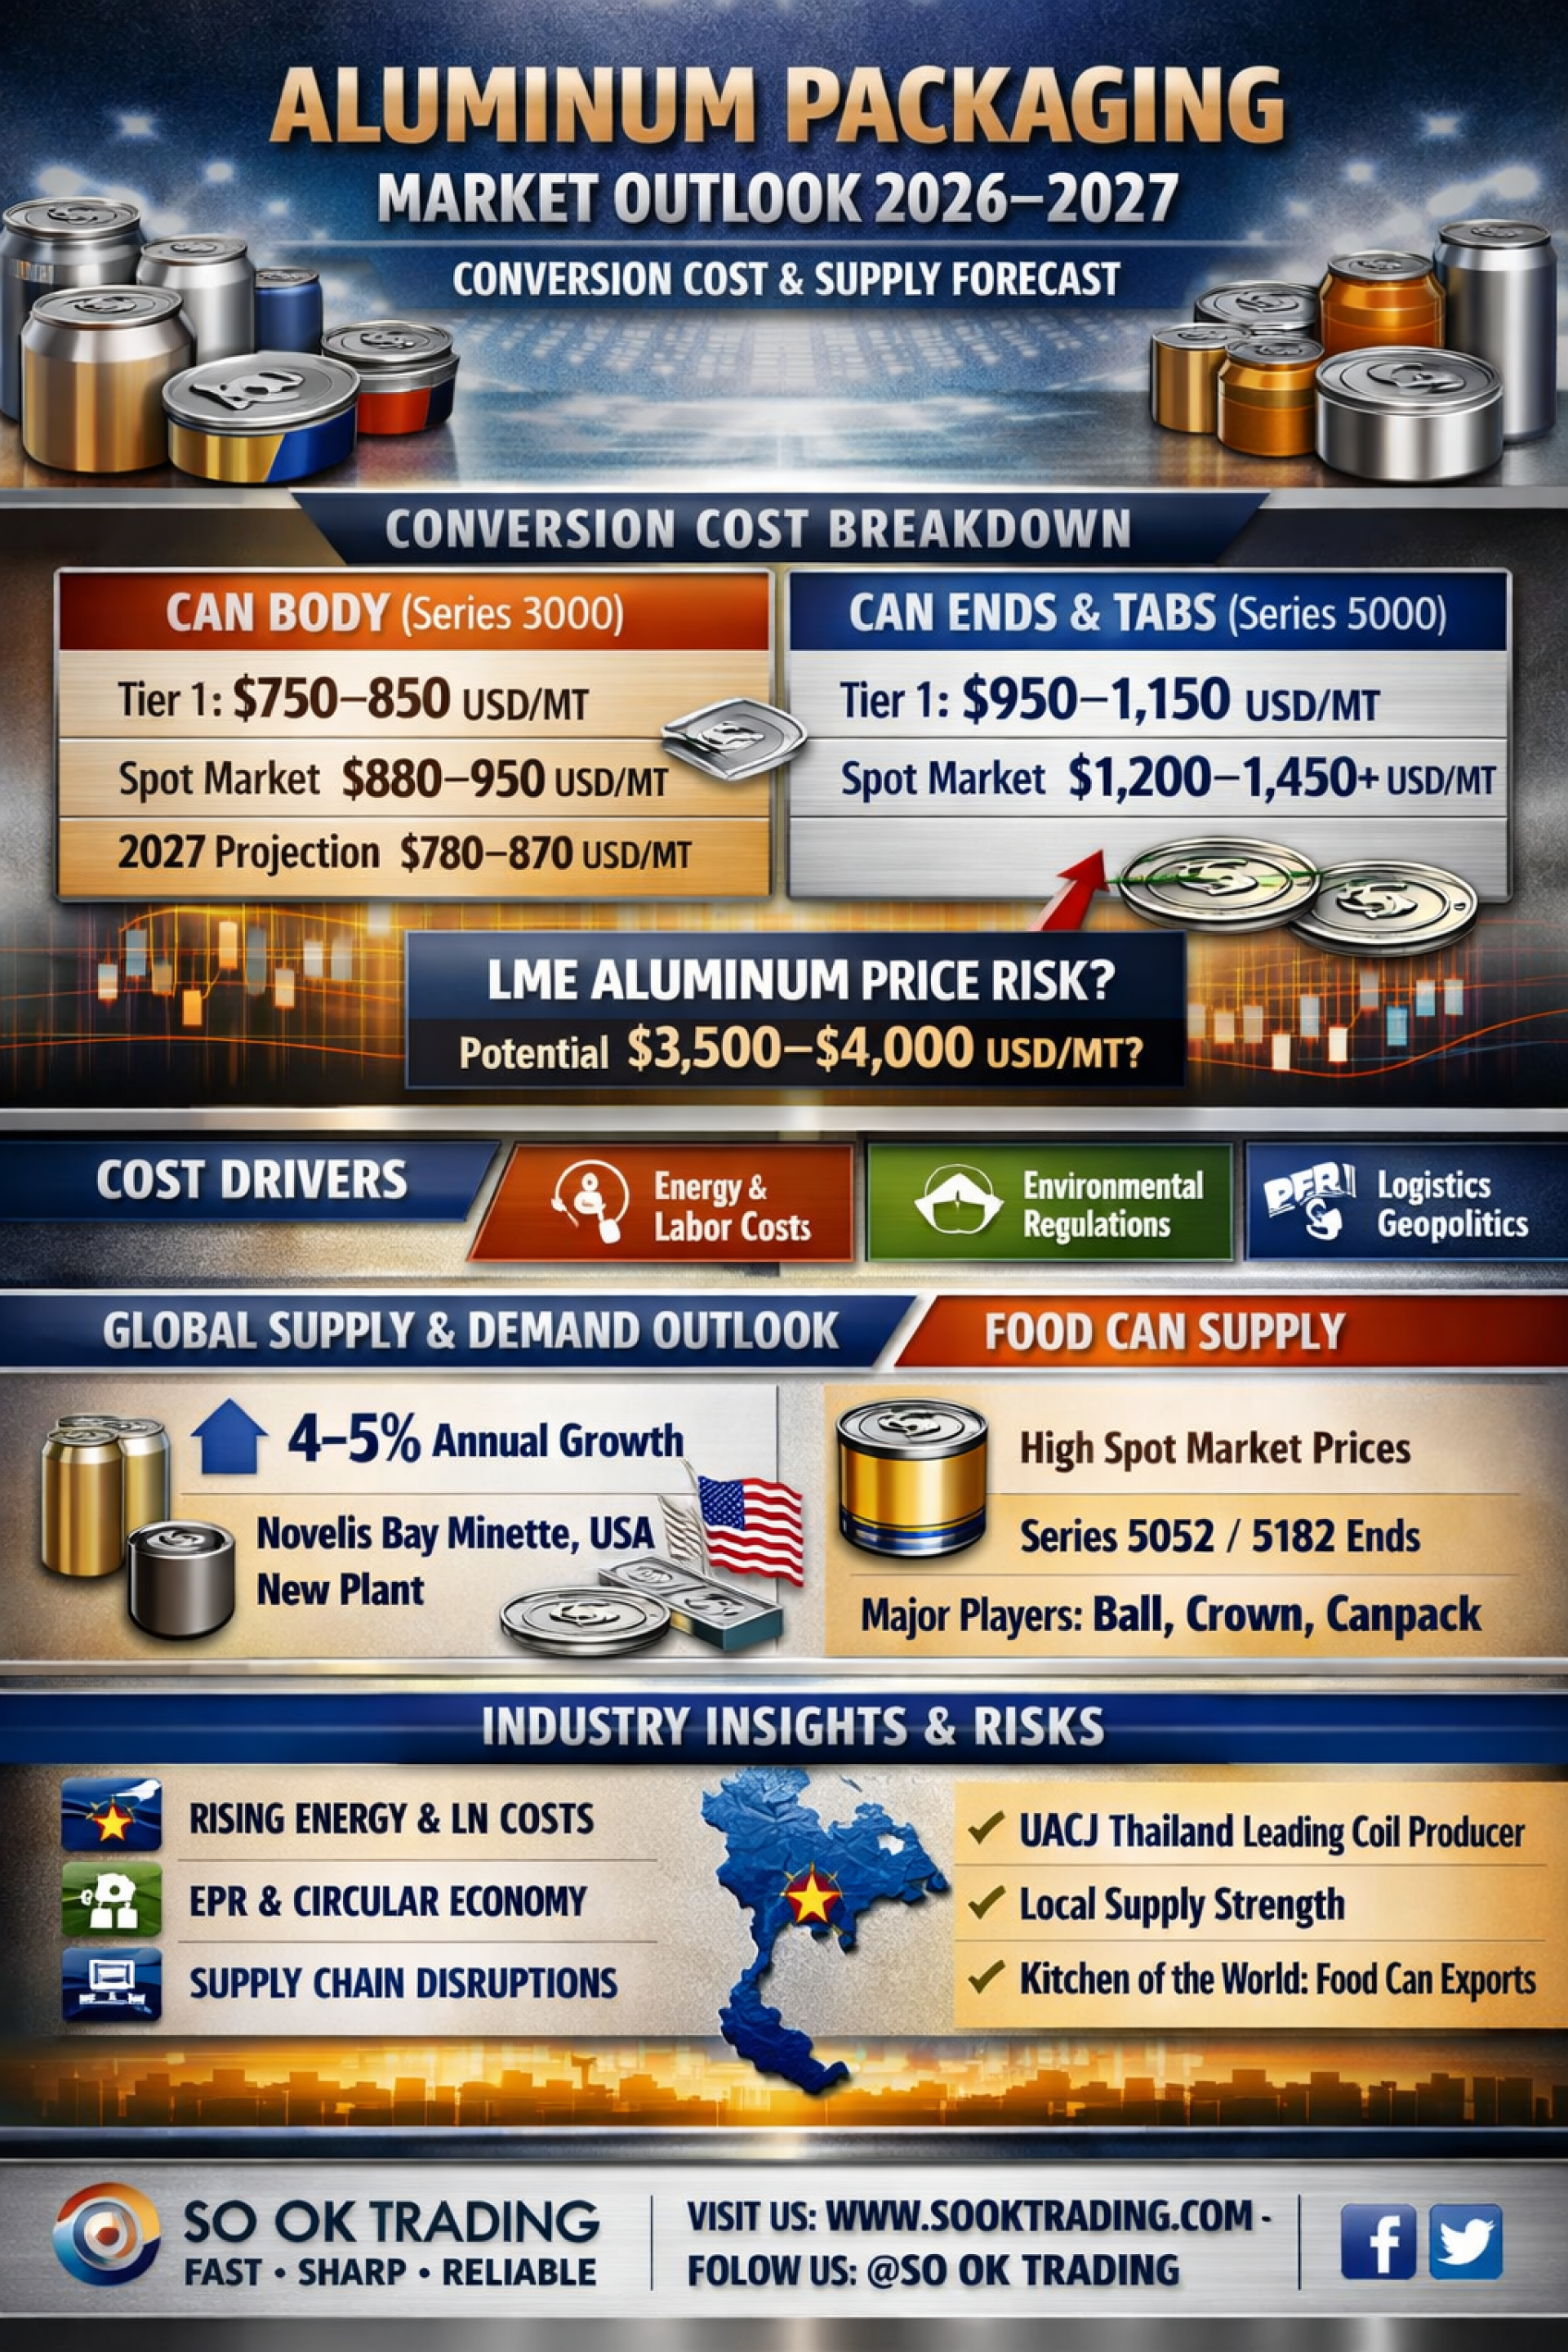
Can Body (Series 3000)
Tier‑1: 750–850 USD/MT (for buyers with ≥6,000 MT/year)
Long‑term Contract: 700–760 USD/MT (for buyers with ≥10,000 MT/year)
Spot Market: 850–950 USD/MT (for buyers with ≤2,500 MT/year, ad‑hoc demand)
2027 Outlook: 780–870 USD/MT
Can Ends & Tabs (Series 5000 – 5182/5052)
Tier‑1: 950–1,150 USD/MT (for regular buyers with stable demand)
Spot Market: 1,200–1,450+ USD/MT
Beverage End (5182 H19): ~1,000–1,200 USD/MT (depending on order size, coating color)
Food End (5052/5182): ~950–1,100 USD/MT (depending on order size, special coatings such as BPANI)
LME Aluminum Price Risk
Prices may surge to 3,500–4,000 USD/MT. Example: LME 3,500 + Conversion 800 + Inland Transport & Other Costs 50 → Approx. 4,350 USD/MT delivered to plant. Additional costs include forming, production, coating, printing, labeling, and delivery to beverage or food can customers.
Cost Drivers & Opportunities
Rising energy and electricity costs (high power consumption in rolling and drying processes)
Environmental regulations (EPR) and circular economy driving demand for aluminum cans over plastics
Logistics and geopolitical risks (war, high transport costs, Middle East supply issues)
Series 5000 alloys require high Mg & Mn, making conversion fees higher than Series 3000
Supply & Demand Outlook 2027
Beverage Can Supply
Demand growth: 4–5% annually (PET substitution, RTD expansion)
Novelis Bay Minette (USA) plant to ease Western supply bottlenecks
Chinese producers (CHALCO, Hongqiao, Mingtai, Nanshan) dominate >60% of global upstream capacity
Food Can Supply
Spot prices may rise to 1,200–1,350 USD/MT (special acid‑resistant coatings, BPANI)
Major players (Ball, Crown, Canpack) benefit from super‑volume contracts, lowering per‑can costs
Thailand Supply Chain & Market
Beverage Can Market (Thailand)
Dominated by TBC, NEXT CAN, SWAN, BCM, ACM
Serving brands: Chang, Singha, Red Bull, Oishi, Nescafé, Carabao
Food Can Market (Thailand)
Thailand is a global base for canned fish and processed fruit exports
Thai Union is the largest exporter of canned seafood worldwide
Supply in Thailand
UACJ (Thailand – Rayong) is ASEAN’s largest can sheet producer, with local supply advantage
Recycling of used beverage cans (UBCs) supports closed‑loop systems, reducing energy costs
Global vs Thailand Outlook
Global
Key players: Novelis, Alcoa, Norsk Hydro, CHALCO, Hongqiao
China controls >60% of global capacity
US/EU expanding capacity (Novelis Bay Minette, focus on recycling)
Cost pressures: energy, CBAM carbon tax, long‑distance logistics
Demand growth: RTD, beer, soft drinks, replacing plastics and tinplate
Recycling: Global brands mandate 75–80% recycled content; aluminum can achieve >95% recycling efficiency
Thailand
UACJ Thailand (Rayong) as the sole coil producer
Local supply advantage, ASEAN proximity
Demand growth: domestic beverage cans + food can exports (“Thailand: Kitchen of the World”)
Risks: antidumping measures from Western markets
Insight Summary
2026–2027 will see supply easing, but energy costs, carbon taxes, and surging demand will continue to pressure the industry. Thailand’s beverage and food can markets are expected to grow steadily, positioning the country as one of the most sustainable aluminum packaging markets globally.
✨ SO OK TRADING Your trusted partner in the Aluminum Packaging Industry. With over 15 years of experience, covering Beverage Cans, Food Cans, Bottle Cans, Ends & Tabs, and Special Coatings (BPANI), we support customers across Thailand, Vietnam, Malaysia, and beyond — with expertise in global supply chains from Australia, Japan, China, Saudi Arabia, USA, and France.
VISIT US: WWW.SOOKTRADING.COM FOLLOW US: Facebook / LinkedIn — SO OK TRADING