Share

Aluminum Price Outlook – February 2026 SO OK TRADING Insight
Last updated: 1 Feb 2026
4976 Views

Aluminum Price Outlook – February 2026

SO OK TRADING Insight

Global Market Overview

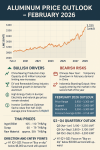
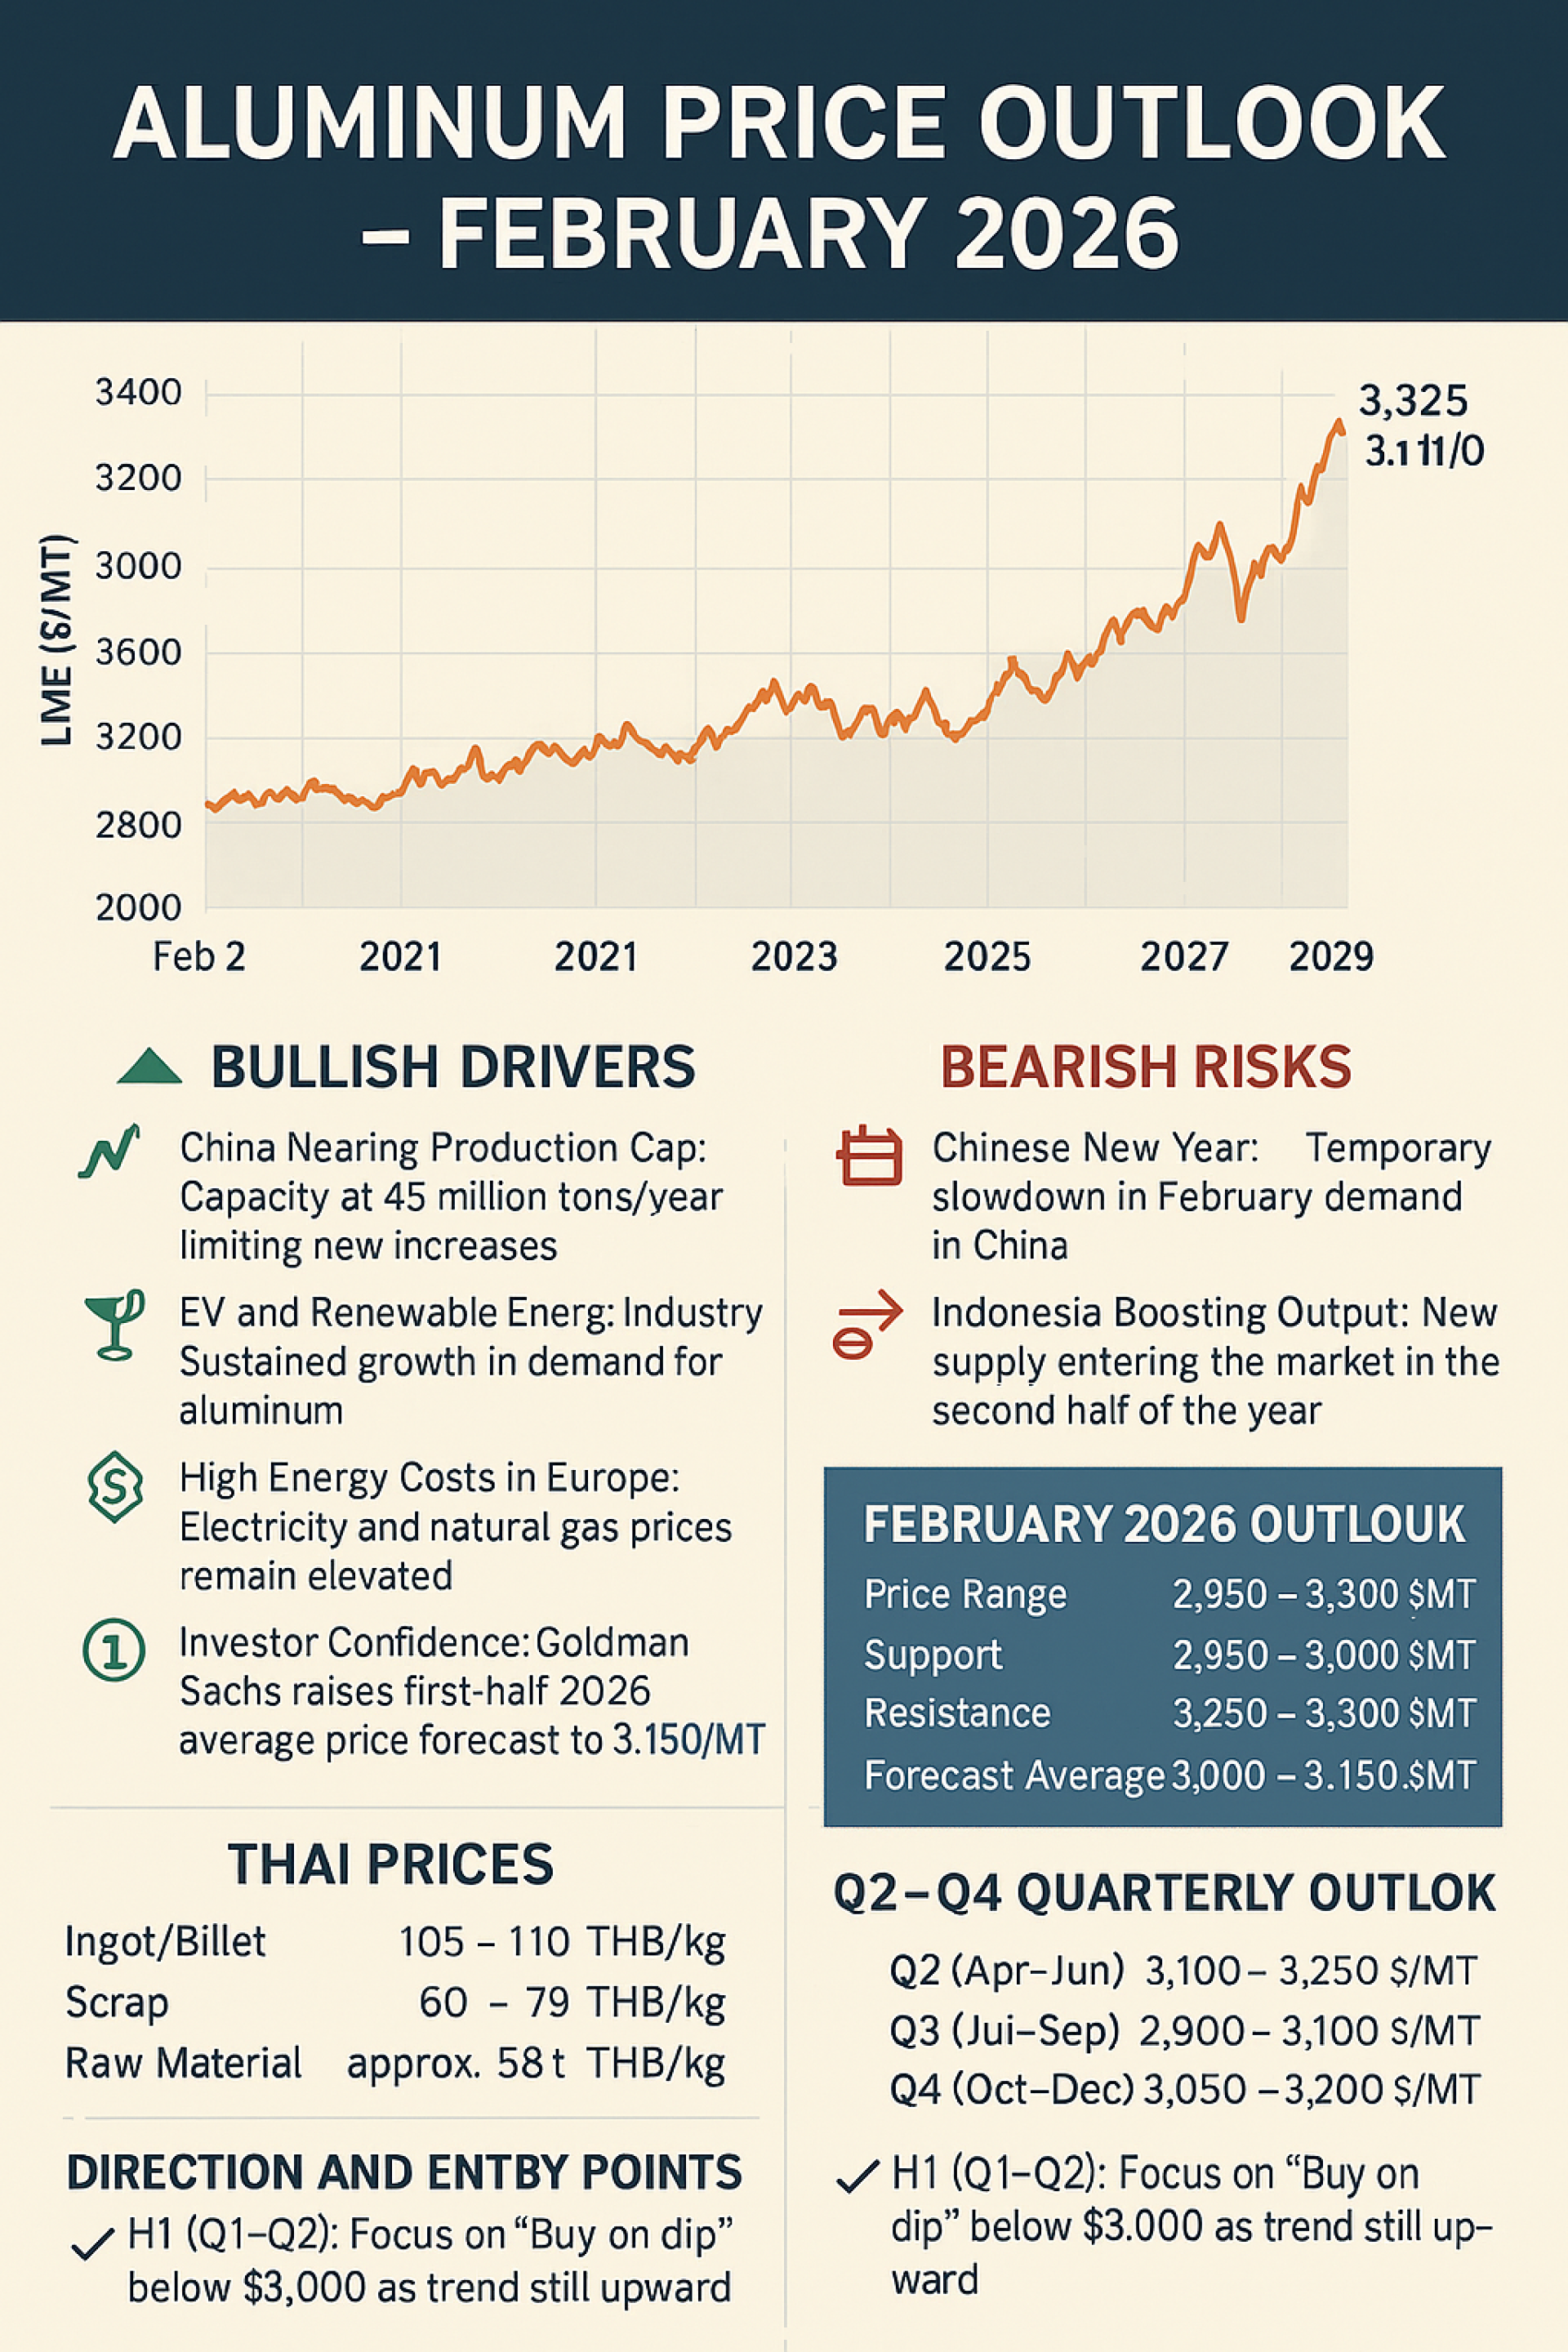
Aluminum prices remain elevated. On January 29, prices surged to USD 3,325/MT, the highest level in nearly four years, before closing at USD 3,110/MT on January 30. This marks a +8.78% increase in just four weeks, reflecting strong investor confidence and tightening supply.

Bullish Drivers

China near production cap: Output approaching 45 million tons/year limits new supply.
EV & renewable energy demand: Structural growth continues to support consumption.
High energy costs in Europe: Elevated electricity and natural gas prices push smelting costs higher.
Investor confidence: Goldman Sachs raised its H1 2026 average forecast to USD 3,150/MT.
Bearish Risks

Chinese New Year slowdown: Temporary demand dip in February.
Indonesia’s new supply: Additional capacity expected to ease tightness in H2 2026.
February 2026 Price Outlook

Range: USD 2,950 – 3,300/MT
Support: USD 2,950 – 3,000/MT
Resistance: USD 3,250 – 3,300/MT
Forecast Average: USD 3,000 – 3,150/MT
Thai Market Reference: Ingot/Billet 105–110 THB/kg Scrap 60–70 THB/kg Raw material ~98 THB/kg
Quarterly Outlook 2026

Q1 (Jan–Mar): USD 3,000 – 3,150 → High but consolidating
Q2 (Apr–Jun): USD 3,100 – 3,250 → Demand rebound + EV/renewables peak season
Q3 (Jul–Sep): USD 2,900 – 3,100 → Indonesia supply enters market
Q4 (Oct–Dec): USD 3,050 – 3,200 → Seasonal winter demand + year-end production push
Strategic Entry Points

H1 (Q1–Q2): Focus on Buy on dip below USD 3,000 as the uptrend remains intact.
H2 (Q3–Q4): Monitor Indonesia and China’s new capacity; consider long-term contracts if supply expands significantly.
 

✨ Summary: Aluminum prices are expected to remain above USD 3,000/MT throughout February 2026, with short-term consolidation after January’s rally. Strong demand from EV and renewable energy sectors, combined with limited supply growth, keeps the market resilient. Price dips below USD 3,000 present attractive stocking opportunities, while the second half of the year requires close monitoring of new supply flows.


Related Content
“Global Metal Market Under Pressure: Fed’s Hawkish Tone & Strong Dollar Shake LME and Thai Baht – SO OK TRADING | 14 SEP 2026”
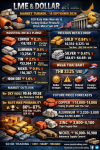
“LME Slumps – Strong Dollar Pressures Metal Market and Thai Baht | SO OK TRADING | 14 September 2026” The London Metal Exchange (LME) saw a significant decline today, following recent record highs across several metals. The downturn was driven by concerns over U.S. inflation and expectations of further interest rate hikes by the Federal Reserve (Fed), which strengthened the U.S. dollar and triggered profit-taking across global metal markets. This development not only impacts commodity prices but also led to the Thai baht weakening to 33.25 per U.S. dollar, directly affecting both import costs for metals and export revenues for Thai businesses. This analysis by SO OK TRADING provides an in-depth look at industrial and precious metal markets, currency trends, and price directions to watch in late 2026 — offering valuable insights for strategic planning and effective risk management.
14 Sept 2026
Nickel: A New Power Transforming the EV Industry — From Coins to Clean Energy, Nickel is Changing the World
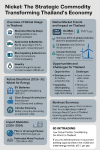
Nickel is no longer just a metal—it’s a strategic force. From EV batteries to green hydrogen, nickel is powering Thailand’s transition to clean energy and advanced industries. Explore how this versatile material is reshaping our economy—and why SO OK TRADING is your trusted partner in connecting global supply to Thai innovation.
7 Feb 2026
 Base Metals Market February 2026: When Volatility Turns into Opportunity - From Volatility to Opportunity: SO OK TRADING ’s In-Depth Analysis of the Base Metals Market: Aluminum, Copper, Zinc, Tin, Lead — The Latest Trends Investors Must Watch
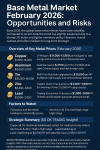
Volatility is back—and base metals are in the spotlight. As February 2026 unfolds, global prices for copper, tin, aluminum, zinc, and lead are showing mixed signals. From clean energy demand to supply disruptions and monetary tightening, the forces shaping this market are anything but simple. At SO OK TRADING, we decode the noise and deliver clarity. This infographic reveals key price ranges, expert forecasts, and strategic insights to help investors navigate the turbulence—and spot the opportunities before they go mainstream.
3 Feb 2026
This website uses cookies for best user experience, to find out more you can go to our Privacy Policy and Cookies Policy
Powered By MakeWebEasy Logo MakeWebEasy