“Gold prices keep soaring without limits — will they stop at the universe? BY SO OK TRADING”
Last updated: 13 Jan 2026
4154 Views
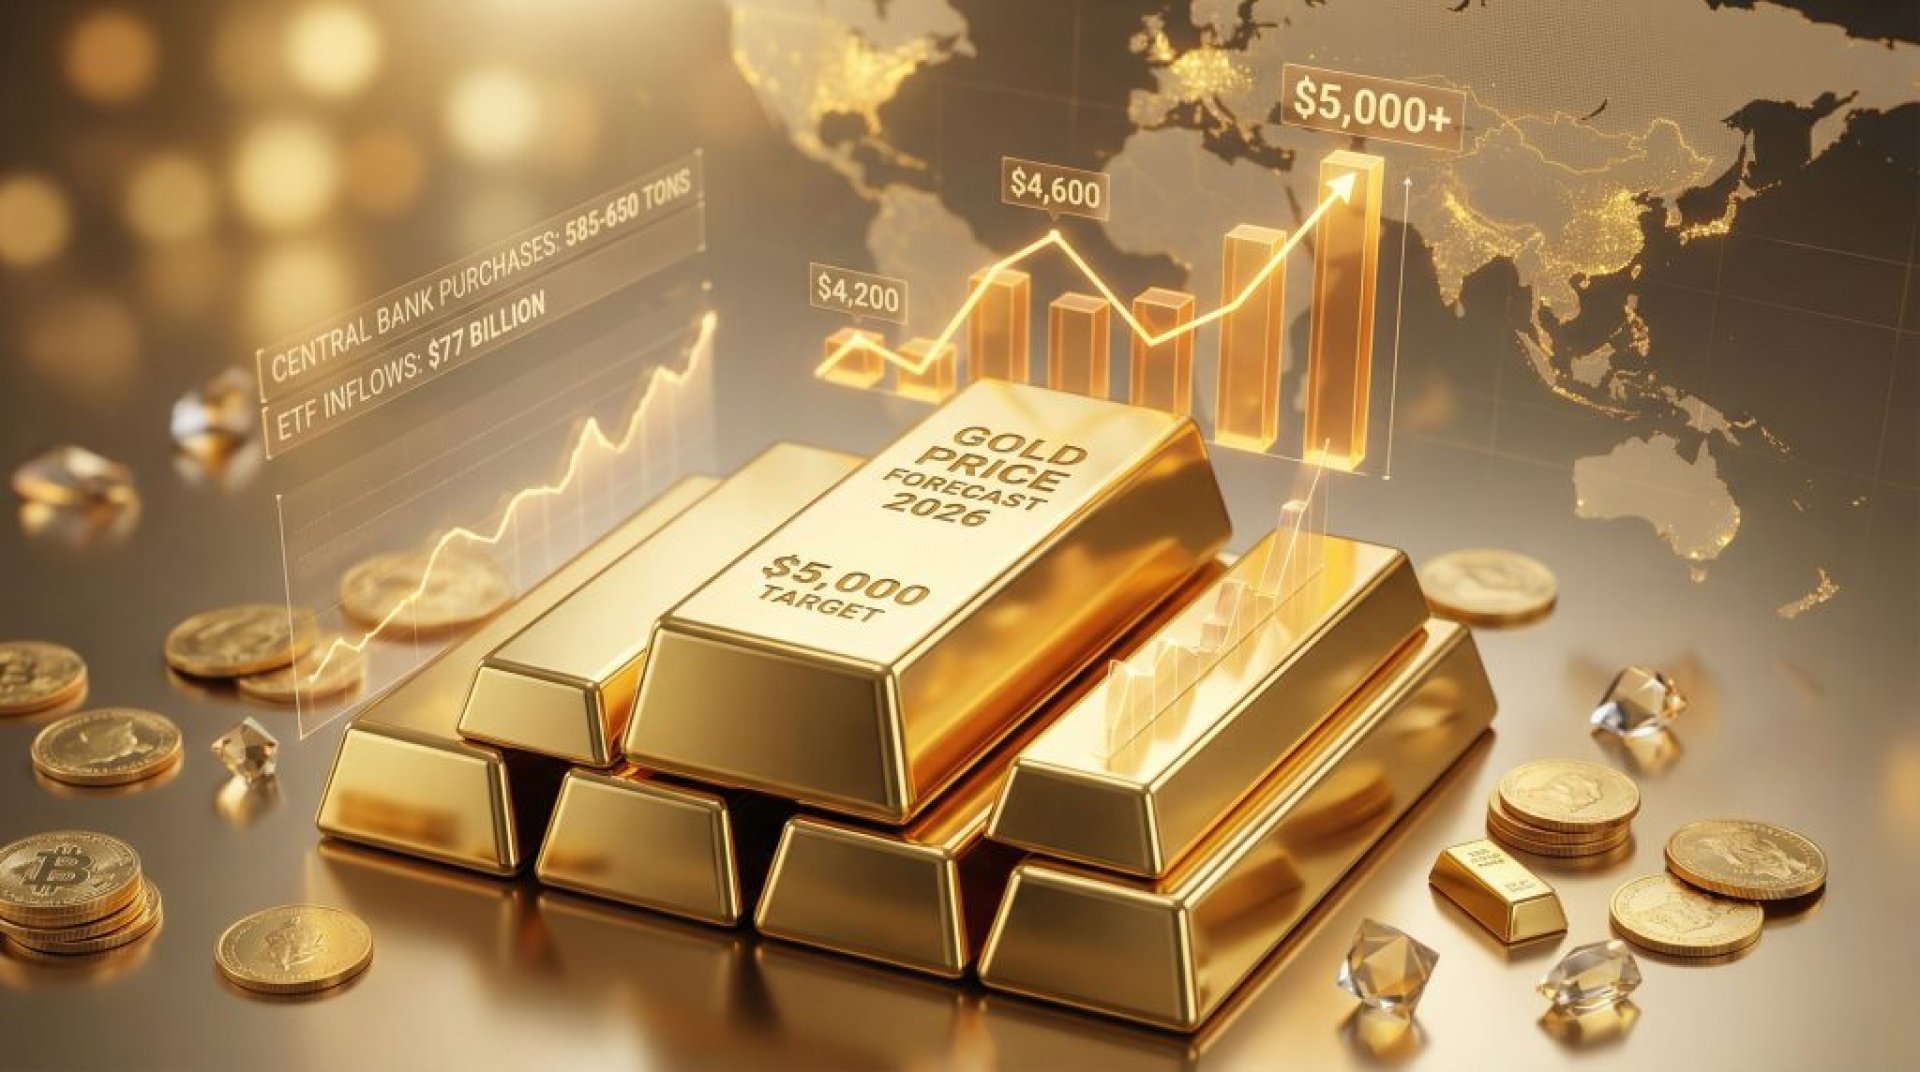
Gold Price Analysis (2015–2025 Trends and Forecast to 2030)
Historical Gold Prices (USD/oz)
2015 – Average ~1,125 USD/oz → Strong US dollar, Fed begins rate hikes
2016 – Average ~1,275 USD/oz → Brexit, rising global economic risks
2017 – Average ~1,290 USD/oz → Strong equity markets, gold relatively stable
2018 – Average ~1,300 USD/oz → US–China trade war begins, market uncertainty increases
2019 – Average ~1,410 USD/oz → Fed rate cuts, economic risks intensify
2020 – Average ~1,815 USD/oz → COVID-19, US QE policy, surge in safe-haven demand
2021 – Average ~1,825 USD/oz → Inflation swings higher, USD weakens, gold begins to rise
2022 – Average ~1,870 USD/oz → Russia–Ukraine war, commodity prices (oil, gold, metals) surge
2023 – Average ~1,985 USD/oz → Global inflation intensifies, Fed continues rate hikes, geopolitical risks persist
2024 – Average ~2,285 USD/oz → Central banks worldwide significantly increase gold purchases (safe-haven asset)
2025 – Average ~3,900 USD/oz → Second wave of inflation, global central banks accumulate gold, de-dollarization trend
Gold Price Outlook (2026–2030)
2026: Goldman Sachs projects ~4,900 USD/oz; other forecasts range ~3,300–3,900 USD/oz
2027–2028: Continued upward trend, potential to reach ~5,500 USD/oz
2029: Strong demand from central banks and investors, price may reach ~6,000–6,500 USD/oz
2030: Conservative forecast places the peak around ~7,200 USD/oz
Positive Drivers
Fed and other central banks expected to cut interest rates
Inflation and global economic uncertainty
Increased gold purchases by central banks (China, India, Russia)
Geopolitical risks, trade policies, rare earth demand in industry
Risk Factors
Rapid global economic recovery with sustained high interest rates → possible gold price correction
US dollar strength or volatility → downward pressure on gold prices
2026 Price Assessment (Probability-Based)
Average forecast: ~4,700 USD/oz
Range: 4,000–5,000 USD/oz
Scenario probabilities:
Base case (45%): 4,500–4,800 USD/oz
Bullish case (35%): 4,800–5,000 USD/oz
Bearish case (20%): 4,200–4,500 USD/oz
Conclusion
Gold prices are expected to remain on an upward trajectory over the next five years. While 2026 may see short-term corrections, the average price is projected around 4,700 USD/oz, with a ceiling near 5,000 USD/oz and a floor around 4,000 USD/oz. By 2030, gold could reach 6,000–7,000 USD/oz, supported by inflationary pressures, monetary easing, and strong central bank demand. Gold remains a critical safe-haven asset and a strategic tool for portfolio diversification.
Would you like me to also prepare a bilingual Thai–English comparison table so you can use it directly in presentations or export documentation?
Historical Gold Prices (USD/oz)
2015 – Average ~1,125 USD/oz → Strong US dollar, Fed begins rate hikes
2016 – Average ~1,275 USD/oz → Brexit, rising global economic risks
2017 – Average ~1,290 USD/oz → Strong equity markets, gold relatively stable
2018 – Average ~1,300 USD/oz → US–China trade war begins, market uncertainty increases
2019 – Average ~1,410 USD/oz → Fed rate cuts, economic risks intensify
2020 – Average ~1,815 USD/oz → COVID-19, US QE policy, surge in safe-haven demand
2021 – Average ~1,825 USD/oz → Inflation swings higher, USD weakens, gold begins to rise
2022 – Average ~1,870 USD/oz → Russia–Ukraine war, commodity prices (oil, gold, metals) surge
2023 – Average ~1,985 USD/oz → Global inflation intensifies, Fed continues rate hikes, geopolitical risks persist
2024 – Average ~2,285 USD/oz → Central banks worldwide significantly increase gold purchases (safe-haven asset)
2025 – Average ~3,900 USD/oz → Second wave of inflation, global central banks accumulate gold, de-dollarization trend
Gold Price Outlook (2026–2030)
2026: Goldman Sachs projects ~4,900 USD/oz; other forecasts range ~3,300–3,900 USD/oz
2027–2028: Continued upward trend, potential to reach ~5,500 USD/oz
2029: Strong demand from central banks and investors, price may reach ~6,000–6,500 USD/oz
2030: Conservative forecast places the peak around ~7,200 USD/oz
Positive Drivers
Fed and other central banks expected to cut interest rates
Inflation and global economic uncertainty
Increased gold purchases by central banks (China, India, Russia)
Geopolitical risks, trade policies, rare earth demand in industry
Risk Factors
Rapid global economic recovery with sustained high interest rates → possible gold price correction
US dollar strength or volatility → downward pressure on gold prices
2026 Price Assessment (Probability-Based)
Average forecast: ~4,700 USD/oz
Range: 4,000–5,000 USD/oz
Scenario probabilities:
Base case (45%): 4,500–4,800 USD/oz
Bullish case (35%): 4,800–5,000 USD/oz
Bearish case (20%): 4,200–4,500 USD/oz
Conclusion
Gold prices are expected to remain on an upward trajectory over the next five years. While 2026 may see short-term corrections, the average price is projected around 4,700 USD/oz, with a ceiling near 5,000 USD/oz and a floor around 4,000 USD/oz. By 2030, gold could reach 6,000–7,000 USD/oz, supported by inflationary pressures, monetary easing, and strong central bank demand. Gold remains a critical safe-haven asset and a strategic tool for portfolio diversification.
Would you like me to also prepare a bilingual Thai–English comparison table so you can use it directly in presentations or export documentation?


Related Content
“Peace Restored, Metals Ignite! Hormuz Strait Reopens, Global Supply Unlocked – Copper Surges, Aluminium Plunges, Zinc Fragile, Lead Oversupplied”
: SO OK TRADING | 16 June 2026
With the USA–IRAN agreement and the reopening of the Hormuz Strait, the global metals market (LME) has reignited overnight!
The easing of geopolitical tensions has “unlocked” the supply chain for base metals, driving prices in sharply different directions depending on the metal.
Some, like Aluminium, are correcting downward as stocks recover, while Copper is soaring on demand from AI and clean energy.
Zinc remains balanced but vulnerable to industrial recovery, and Lead faces oversupply due to the EV transition away from lead-acid batteries.
16 Jun 2026

Global and Thai Gold Prices in the 2026 Economic Crisis
14 Jul 2026
Deep Dive into Thailand’s Aluminum Packaging Market 2026
From SMEs to 10 Million Cans per Month
Article by SO OK TRADING | 30 MAY 2026
In today’s era, packaging is no longer just a container — it is the face of the brand. Thailand’s aluminum packaging market is heating up and expanding rapidly across food, beverage, and cosmetics industries.
Prices range from as low as 0.75 THB per unit to more than 60 THB per unit, depending on type, size, and order volume. The larger the order, the lower the unit cost — opening the door to “Mega‑Volume” deals that global manufacturers use as their key strategy.
SO OK TRADING takes you on a journey from SMEs ordering a few thousand units to industrial contracts of 10–12 million cans per month, revealing the real pricing structures of beverage cans, food cans, and Easy Open End (EOE) lids in the Thai market.
30 May 2026
