“Copper Momentum 2026 – Strategic Metal Driving the Future | SO OK TRADING Insight: Copper in the AI Era Transforming Industries | Copper Price Outlook – August 24, 2026”

Copper Price Situation Summary (August 24, 2026)
SO OK TRADING
Copper: The Strategic Metal of the AI and Clean Energy Era
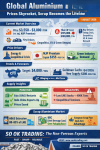
Global copper prices remain elevated near record highs, despite a slight correction in early August. On COMEX, prices averaged around USD 6.54–6.58 per pound, while LME held above USD 14,000 per metric ton, reflecting robust demand from modern industries.
Bullish Factors
AI and New Energy Industries: Demand surges from cables and cooling systems in data centers, as well as expansion in EVs and solar power.
Weak Dollar: Makes copper cheaper for buyers holding other currencies.
Supply Risks: Production issues in Chile and Peru, along with geopolitical uncertainty, push costs and logistics higher.
Bearish Factors ⚠️
Inventory Build-Up: Increased LME warehouse inflows ease tightness concerns.
China’s Economic Slowdown: Manufacturing and construction reduce copper demand, while U.S. tariff policies add pressure.
Strategic Outlook
Key Support: USD 13,800–14,000. Holding above this level keeps the bullish trend intact.
Key Resistance: USD 14,500–15,000. A breakout could test new highs.
Demand Destruction Risk: Prices above USD 14,000 may cause buyers to delay orders or switch to substitutes.
Copper Cathode Market (99.99% Pure)
Strong Prices: LME Spot/Three-Month at USD 14,040–14,200.
Premiums at Record Highs: CODELCO and Aurubis raised European premiums to USD 325/ton (+39% YoY).
Demand Outlook (2026–2030): CAGR 5.27–6.3%, driven by AI data centers, smart grids, and EVs.
Green Premium: Low-carbon cathodes gain traction under ESG measures.
Supply Constraints
El Teniente mine (Chile) and Peru underperforming targets.
Sulfuric acid costs surge due to geopolitical issues.
U.S. trade barriers intensify supply competition.
Price Forecasts
J.P. Morgan: Q4 2026 may reach USD 14,800; 2027 average USD 13,800.
Trading Economics: Next 12 months could break USD 15,000–15,500.
Short-Term Risk: Possible pullback to USD 13,300–13,400 support.
China and Asia Market
Yangshan Premiums: Jump to USD 85–100/ton (from lows of USD 20).
South Korea: CODELCO offers premiums up to USD 330/ton (+200%).
China Drivers: Crackdown on fake tax invoices reduces scrap supply; UHV transmission lines and renewable projects boost demand.
Imports: 1.67 million tons in first 7 months, slightly down but still over 55% of total imports.
Exports: Down more than 70% YoY, showing stronger domestic consumption.
Global Copper Outlook
Short-Term (2026): Prices remain high in USD 13,500–15,000 range.
Medium-Term (2027–2028): USD 13,000–16,000 range, supported by mine expansions.
Long-Term (2029–2030): Structural deficit drives prices beyond USD 17,000.
Key Drivers: AI, EVs, clean energy, smart grids, power infrastructure investment Risks: China slowdown, geopolitical tensions, smelting bottlenecks
Thailand Copper Market (August 2026)
Scrap Copper Average: THB 270–438/kg
Bright Bare Copper Wire: THB 395–438/kg
White-Plated Copper: THB 270–406/kg
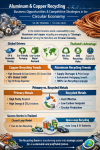
Local Premium: USD 110–150/ton → Thai smelters increasingly turn to recycled scrap.
Recycling Industry Trend: Rising demand for scrap copper to cut costs and avoid import tariffs.
Impact on Thai Businesses
Wire and electronics manufacturers must adjust strategies to cope with high premiums.
Recycling operators gain opportunities to add value with high-quality scrap copper.
Conclusion ✨
Copper has evolved from a common commodity into a strategic metal of the AI and clean energy era. Prices hold firm at USD 14,000–14,200 per ton, driven by demand from data centers, smart grids, and EVs, while supply remains tight and premiums hit record highs.
SO OK TRADING: Your Business Partner FAST SHARP RELIABLE WWW.SOOKTRADING.COM FACEBOOK: SOOK TRADING Thailand’s True Non-Ferrous Business Leader