Share

“Global Sugar Industry 2024/25: From Sweetness to ‘Oil on Land’ — Transforming into Aviation Fuel and Bio-Economy in the Net Zero Era”

Last updated: 24 Mar 2026
872 Views

 Global Sugar Industry 2024/25: From Sweetness to Future Energy

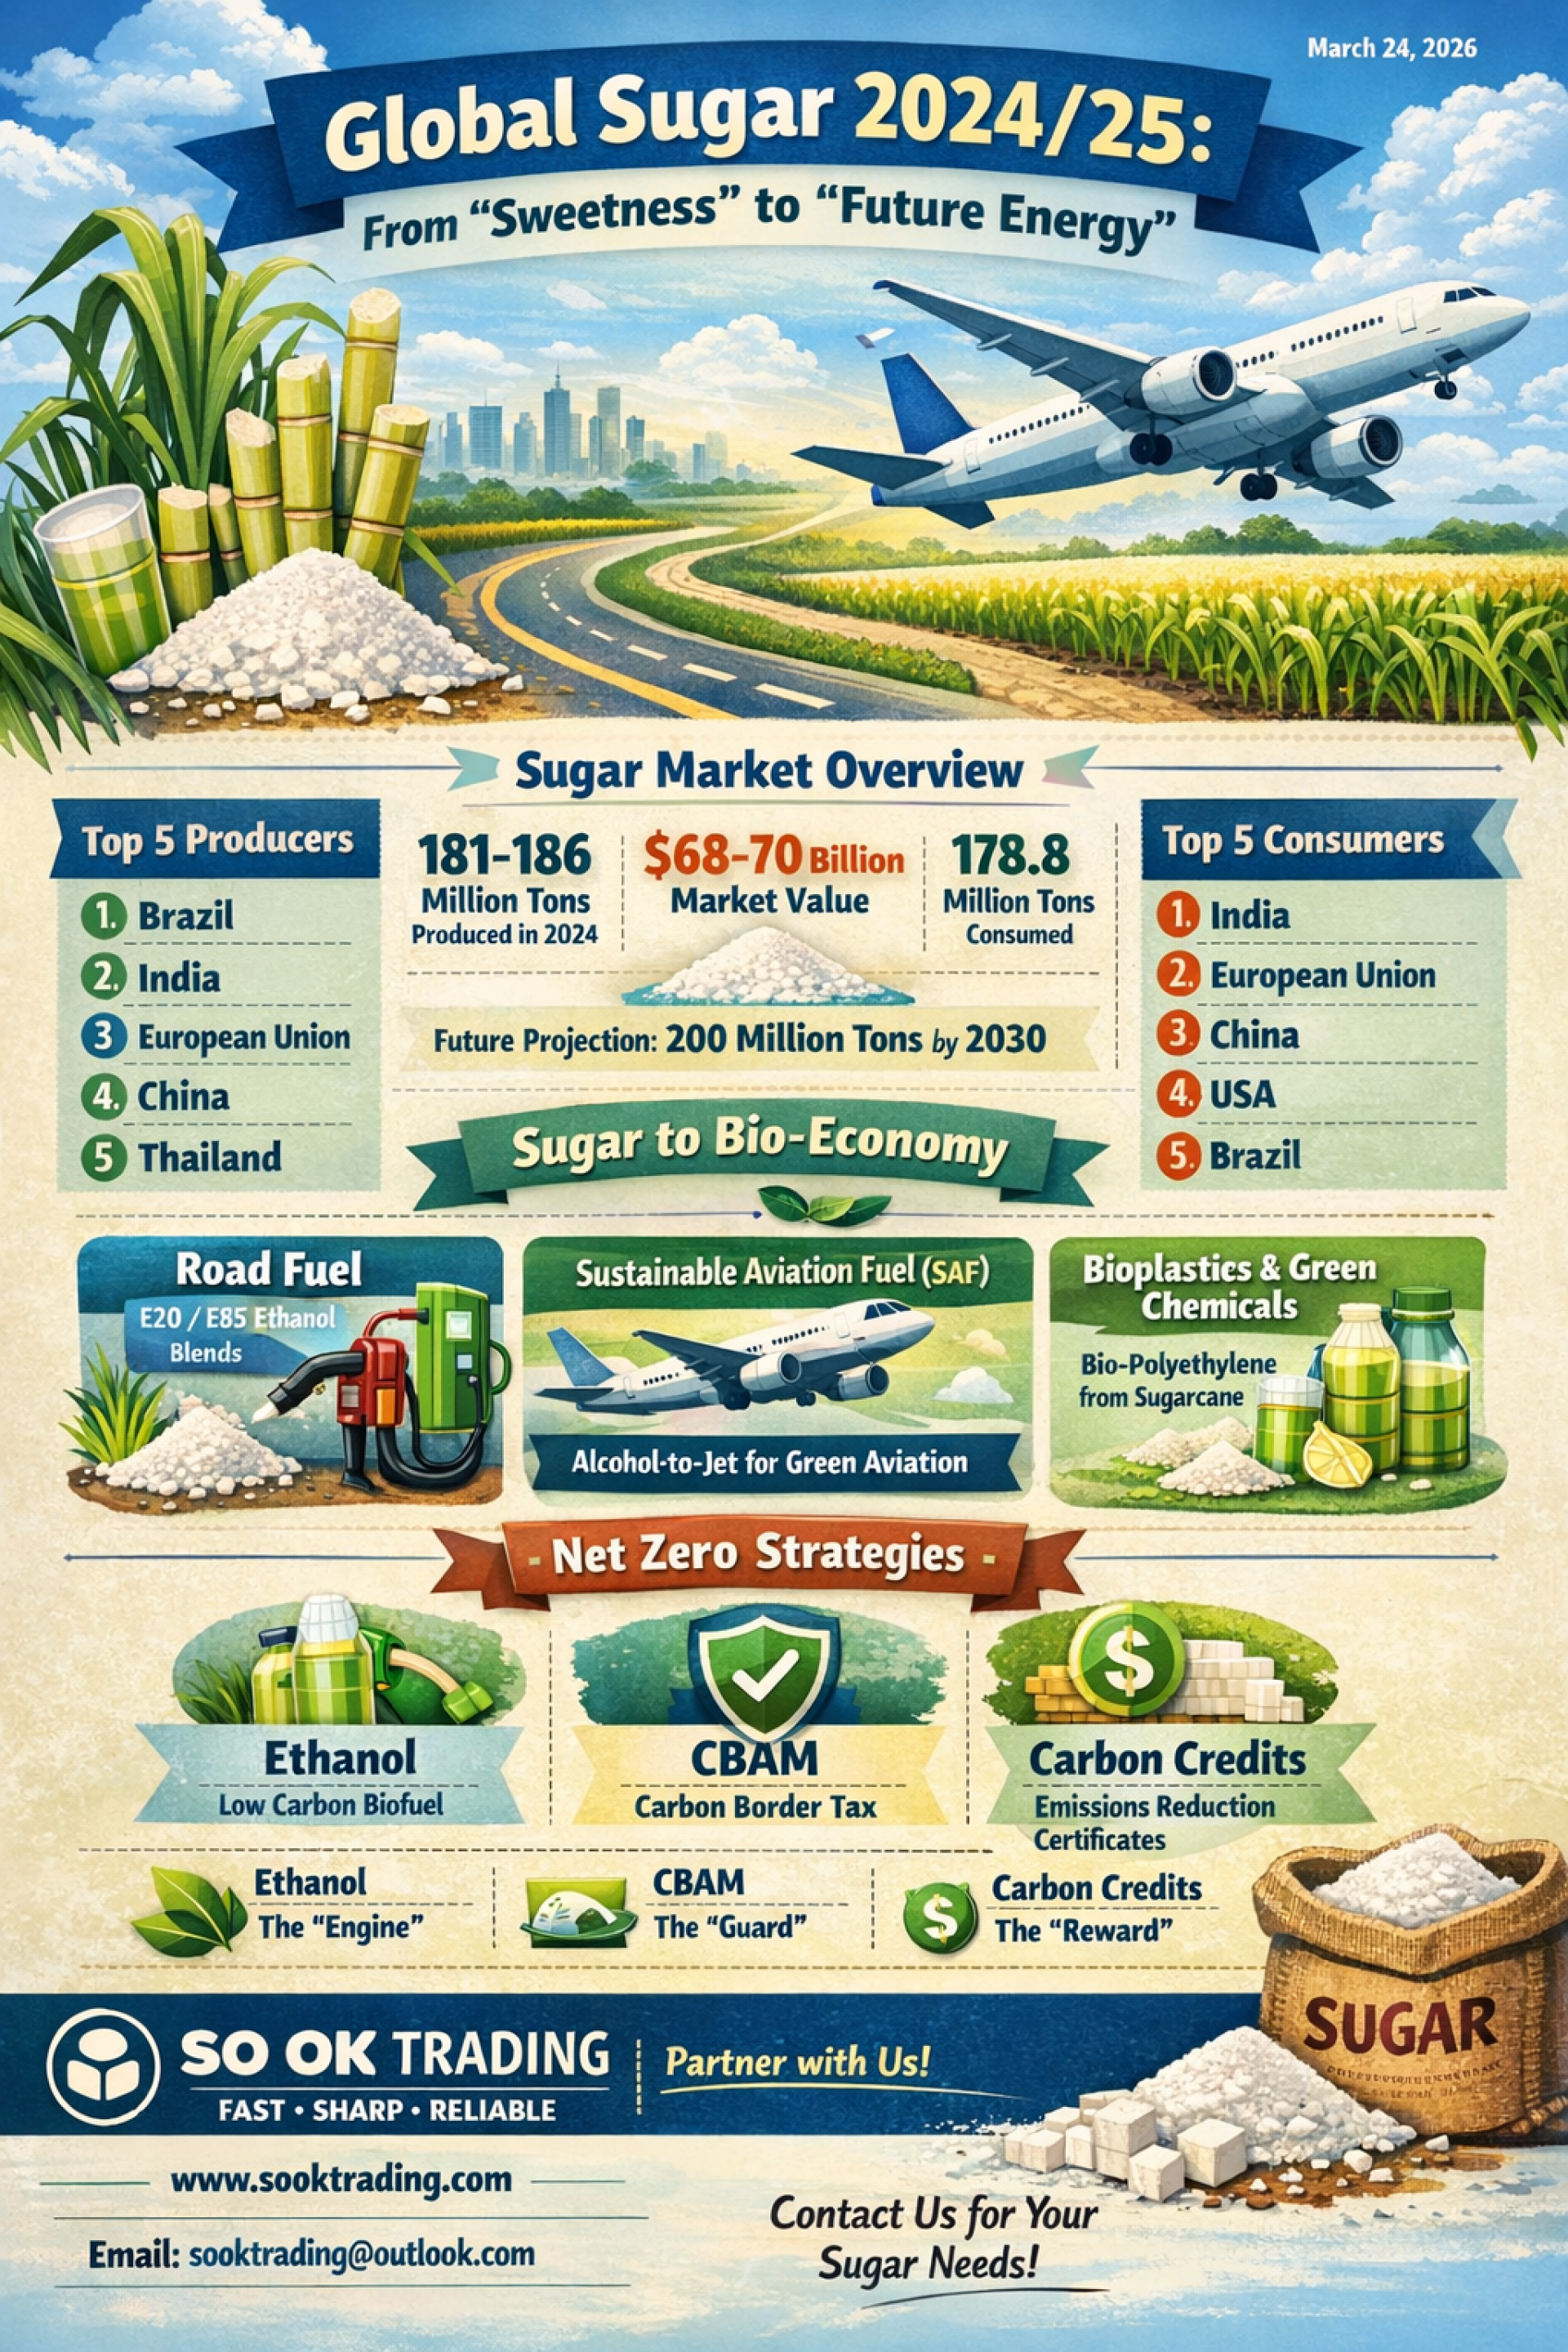
Article by SO OK TRADING March 24, 2026

The sugar industry is undergoing a major transformation. Once seen merely as a flavoring ingredient for food and beverages, sugar is now evolving into a biofuel and a green raw material directly tied to the world’s Net Zero ambitions.


Global Sugar Market Overview

Production (2024): 181–186 million tons
Market Value: USD 68–70 billion
Consumption: 178.8 million tons (driven by food, beverage, and bakery industries)
Average Prices: Raw sugar USD 448.6/ton; White sugar USD 577.8/ton
Projection: Output expected to reach 200 million tons by 2030
 

Top 5 Sugar Producers (as of end-2025)

Brazil — 44–47 million tons annually; world’s largest exporter with flexibility to switch between sugar and ethanol.
India — 33–35 million tons; second-largest producer, with exports restricted to stabilize domestic prices.
European Union (EU) — 16 million tons; beet-based production facing environmental regulation challenges.
China — 11 million tons; insufficient for domestic demand, heavily reliant on imports from Brazil and Thailand.
Thailand — 10–14 million tons; fifth-largest producer but second–third largest exporter globally, especially in raw sugar.
 

Top 5 Sugar Consumers (as of end-2025)

India — 28–32 million tons; largest consumer due to population size and sweet-based culture.
European Union (EU) — 16–17 million tons; strong demand in food and bakery industries, though health trends are reducing sugar intake.
China — 15–16 million tons; major net importer as consumption outpaces production.
United States — 11–12 million tons; highest per capita consumption, with import quotas in place.
Brazil — 9–10 million tons; large domestic demand driven by population and food industry.
 

From Sugar to Ethanol: The Bio-Economy Transition

Sugarcane is no longer just about sweetness — it is becoming a biorefinery powerhouse:

Road Fuel: Thailand and India promote ethanol-blended fuels (E20/E85). India targets E20 by 2025, diverting 5–6 million tons of sugar from global markets.
Aviation Fuel (SAF): Brazil and India are pioneering Alcohol-to-Jet technologies. SAF commands premium prices and is emerging as the “star” of clean energy.
Bioplastics & Green Chemicals: Ethanol is a feedstock for bio-polyethylene. Global brands like Coca-Cola and LEGO are adopting plant-based packaging.
 

Ethanol, CBAM, and Carbon Credits: Three Tools for Net Zero

Though distinct, these mechanisms complement each other toward the same goal:

Ethanol: Low-carbon biofuel replacing fossil fuels.
CBAM (Carbon Border Adjustment Mechanism): EU’s carbon tariff penalizing high-emission products.
Carbon Credits: Certificates for verified emission reductions, tradable for revenue.
In simple terms:

Ethanol = The Engine
CBAM = The Guard
Carbon Credits = The Reward
 

Strategic Outlook

Rising oil prices → More ethanol production, sugar shortages, and price spikes.
Stricter climate policies → Sugarcane ethanol becomes a premium product for aviation and green chemicals.
Thailand → Positioned to become ASEAN’s Bio-Hub, leveraging its sugarcane production and export strength.
✨ The sugar industry is shifting from a volatile commodity to a high-value Bio-Economy, linked to clean energy, bioplastics, and Net Zero policies.


SO OK TRADING: Your Business Partner

SO OK TRADING — FAST • SHARP • RELIABLE

Visit us: www.sooktrading.com
Inquiries: sooktrading@outlook.com

We provide high-quality sugar for industrial and commercial use, with competitive pricing and export-ready services.


Related Content
RDF (เชื้อเพลิงชีวมวลจากวัสดุเหลือใช้และขยะ): เชื้อเพลิง RDF คืออะไร และ ทำประโยชน์อะไรกับ Green Energy ได้บ้าง
Refuse Derived Fuel : RDF โดยทั่วไปนิยมเรียกว่า เชื้อเพลิงขยะ แต่สำหรับคณะกรรมาธิการการทรัพยากรธรรมชาติและสิ่งแวดล้อม สนช. เรียกว่า ก้อนเชื้อเพลิงขยะ และได้มีการพิจารณาศึกษา RDF ซึ่งเป็นประโยชน์กับการจัดการขยะชุมชน รวมทั้งขยะอุตสาหกรรมที่ไม่ใช่ขยะอันตราย ซึ่งมีการทิ้งปะปนกันจนแยกออกได้ยาก จึงขออนุญาตสรุปเนื้อหาของผลการศึกษาจากคณะกรรมาธิการพร้อมแนวคิดจากประสบการณ์ เพื่อเป็นแนวทางการจัดการขยะแบบไทยๆ ดังนี้ การผลิต RDF เป็นแนวทางที่ประเทศพัฒนาแล้วใช้อยู่ โดยเฉพาะอย่างยิ่งในภาคพื้นยุโรป เช่น เยอรมนี สวีเดน ฟินแลนด์ ฯลฯ ทั้งขยะใหม่และขยะเก่าที่ตกค้างในบ่อฝังกลบ สามารถนำมาผลิต RDF ได้ดี การผลิต RDF สามารถทำได้โดยเทคโนโลยีคนไทย เครื่องจักรผลิตในไทย ไปจนถึงการนำเข้าเครื่องจักรคุณภาพสูงจากต่างประเทศในกรณีที่ต้องการผลิตจำนวนมากๆ ตั้งแต่ 100 ตันต่อวันขึ้นไป เมื่อปี พ.ศ. 2557 กรมพัฒนาพลังงานทดแทนและอนุรักษ์พลังงาน ได้ศึกษาพื้นที่ศักยภาพเบื้องต้นว่า มีการผลิต RDF ไม่น้อยกว่า 90 แห่งทั่วประเทศ จากการสำรวจพื้นที่ผลิต RDF 21 แห่ง ใน 15 จังหวัด พบว่ามีการลงทุนกว่า 3,000 ล้านบาท เงินทุนหมุนเวียนสู่ชุมชน 570 ล้านบาท สามารถคืนทุนได้ในเวลา 10-13 ปี ราคาขายของ RDF เริ่มต้นตันละ 500-1,200 บาท ขึ้นอยู่กับคุณภาพและค่าความร้อนของ RDF (ปกติอยู่ระหว่าง 3,000-5,000 กิโลแคลอรี่ต่อกิโลกรัม) ปัญหาของการผลิต RDF ก็คือ ตลาด ซึ่งมีผู้ซื้อน้อยราย ความต้องการใช้ RDF น้อยกว่าปริมาณที่มีการผลิต อีกทั้งจุดรับซื้อมีเพียงไม่กี่จุดทั่วประเทศ เท่าที่มีโรงงานผลิตปูนซีเมนต์ จากการที่มีการผลิต RDF จากบ่อฝังกลบและจากขยะใหม่ในปริมาณมาก RDF จึงล้นตลาดจนราคาซื้อขายไม่คุ้มค่าการลงทุน อีกทั้งโรงไฟฟ้าที่ใช้เชื้อเพลิงขยะส่วนใหญ่ก็มีภาระในการจัดการขยะตามสัญญากับองค์กรปกครองส่วนท้องถิ่น เมื่อราคาตํ่ามากๆ ทำให้เชื้อเพลิง RDF ถูกนำไปใช้ในโรงไฟฟ้าประเภทต่างๆ อย่างไม่เป็นทางการ ดังนั้น สมาคมการค้าพลังงานขยะ จึงได้มีหนังสือถึงประธานคณะกรรมการกำกับกิจการพลังงาน ให้มีการสนับสนุนยกระดับเชื้อเพลิงขยะให้เป็นเชื้อเพลิงเชิงพาณิชย์ เพื่อให้เกิดธุรกิจการค้าที่มั่นคงและเป็นที่ยอมรับของสถาบันการเงินต่างๆ พร้อมกันนี้ทางสมาคมการค้าพลังงานขยะ ยังได้มีเสนอแนวทางการจัดประเภทของ RDF ให้เหมาะสมกับสภาพความเป็นจริงของประเทศไทย เพื่อสะดวกต่อการส่งเสริมของภาครัฐและสามารถกำหนดราคาซื้อขายได้อย่างเหมาะสมและเป็นธรรมต่อทุกฝ่าย ประเภท กระบวนการผลิตเชื้อเพลิง (Method of Manufacture) กลุ่มลูกค้าที่ใช้ RDF RDFRDF – 1 RDF เกรดพรีเมียม (Solid Recovered Fuel : SRF) ผ่านการย่อย-คัดแยกชนิด และขนาดด้วยเครื่องจักร มีขนาด RDF 50-100 มิลลิเมตร ค่าความร้อนสูง อุตสาหกรรมปูนซีเมนต์ และโรงงานอุตสาหกรรม RDF – 2 RDF คุณภาพสูง ผ่านเครื่องย่อย-คัดแยกชนิดและขนาด RDF มีขนาด 90-150 มิลลิเมตร ค่าความร้อนสูง โรงไฟฟ้าพลังงานขยะ และเป็นเชื้อเพลิงเสริมโรงไฟฟ้าชีวมวล RDF – 3 RDF คุณภาพปานกลาง ผ่านการย่อยและคัดแยกเบื้องต้น ขนาด RDF 200-300 มิลลิเมตร ค่าความร้อนปานกลาง-สูง โรงไฟฟ้าขยะทั่วไป RDF – 4 RDF จากบ่อฝังกลบ ผ่านการร่อนด้วยเครื่องจักร แยกดินออก RDF มีขนาดใหญ่เล็กตามสภาพ ต้องนำไปปรับปรุงคุณภาพก่อนใช้เป็นเชื้อเพลิง ลูกค้าที่มีระบบปรับปรุงคุณภาพขยะ ขอยกตัวอย่างบทสรุปจากสมุดปกขาว “เชื้อเพลิงขยะ (RDF) ทางออกของการจัดการขยะชุมชน” 1. โรงงานปูนซีเมนต์ทั้ง 4 แห่งในประเทศไทย ที่รับซื้อ RDF ในพื้นที่มีไม่ทั่วถึงเพียงพอที่จะรับขยะชุมชน 2. ภาคตะวันออก ภาคตะวันออกเฉียงเหนือ และภาคใต้ตอนบน ไม่มีโรงงานปูนซีเมนต์ตั้งอยู่ 3. ราคาเชื้อเพลิงจากฟอสซิล มีผลต่อราคาและการรับซื้อ RDF 4. องค์กรปกครองส่วนท้องถิ่นส่วนใหญ่ ไม่รู้วิธีการผลิต RDF ให้ได้คุณภาพ เพื่อให้ได้ราคาดี 5. รัฐบาลควรส่งเสริมและสนับสนุนให้องค์กรปกครองส่วนท้องถิ่น/ชุมชนผลิตเชื้อเพลิงขยะ RDF ที่มีคุณภาพโดยผ่านการทำสัญญาแบบ Supply Chain ในระยะยาว และสร้างระบบประกันคุณภาพและราคาขาย รวมทั้งค่าขนส่งสามารถปรับตามราคาเชื้อเพลิง 6. การผลิต RDF มุ่งเน้นการกำจัดขยะที่ตกค้างและเกิดขึ้นใหม่อย่างเป็นระบบ ควรใช้เป็นโอกาสให้มีผลต่อการคัดแยกขยะ และการเปลี่ยนแปลงพฤติกรรมคนไทยในอนาคต 7. การผลิต RDF มีผลประโยชน์ร่วมหลายด้าน เช่น ลดปัญหานํ้าเสีย การแพร่ระบาดของโรค สร้างรายได้ให้องค์กรปกครองส่วนท้องถิ่นและชุมชน ได้พื้นที่ขยะที่ฝังกลบหรือกองทิ้งมาใช้ประโยชน์ด้านอื่นๆ ลดการนำเข้าเชื้อเพลิง ลดความขัดแย้ง และเป็นการร่วมกับประชาคมโลกในการลดภาวะโลกร้อน “ขยะไม่ใช่ทอง แต่เป็นของเสียที่ต้องช่วยกันกำจัด” RDF 3: Recycling Energy
24 Nov 2025
“Middle East Crisis Update – April 16, 2026: Oil • Fertilizer • Naphtha — War & Market Moves, When Energy and Raw Materials Become Economic Weapons, A War That Touches Every Breath of the World”
Middle East Crisis Update: War • Energy • Finance (April 16, 2026) The Middle East remains tense and complex, with ongoing battles, fragile diplomacy, and economic ripples spreading worldwide. The closure of the Strait of Hormuz and continued attacks across multiple fronts have driven oil and naphtha prices sharply higher, while global stock markets swing in response to peace talk headlines. This crisis is not confined to the region — it reverberates across every nation. Rising energy costs, soaring fertilizer prices, and escalating shipping fees are directly impacting the daily lives of people everywhere. Stay informed with our latest English Infographic, which captures the dimensions of war, energy, and finance in a concise, easy-to-understand format — ready to be leveraged for business insights and strategy. SO OK TRADING
16 Apr 2026
This website uses cookies for best user experience, to find out more you can go to our Privacy Policy and Cookies Policy
Powered By MakeWebEasy Logo MakeWebEasy