Share

“March 2, 2026: War Shakes Global Markets — Currency Volatility, Oil Surge, Stock Sell-off, Metals Under Pressure, Gold Soaring. A Complete One-Day Snapshot by SO OK TRADING”
Last updated: 2 Mar 2026
3807 Views

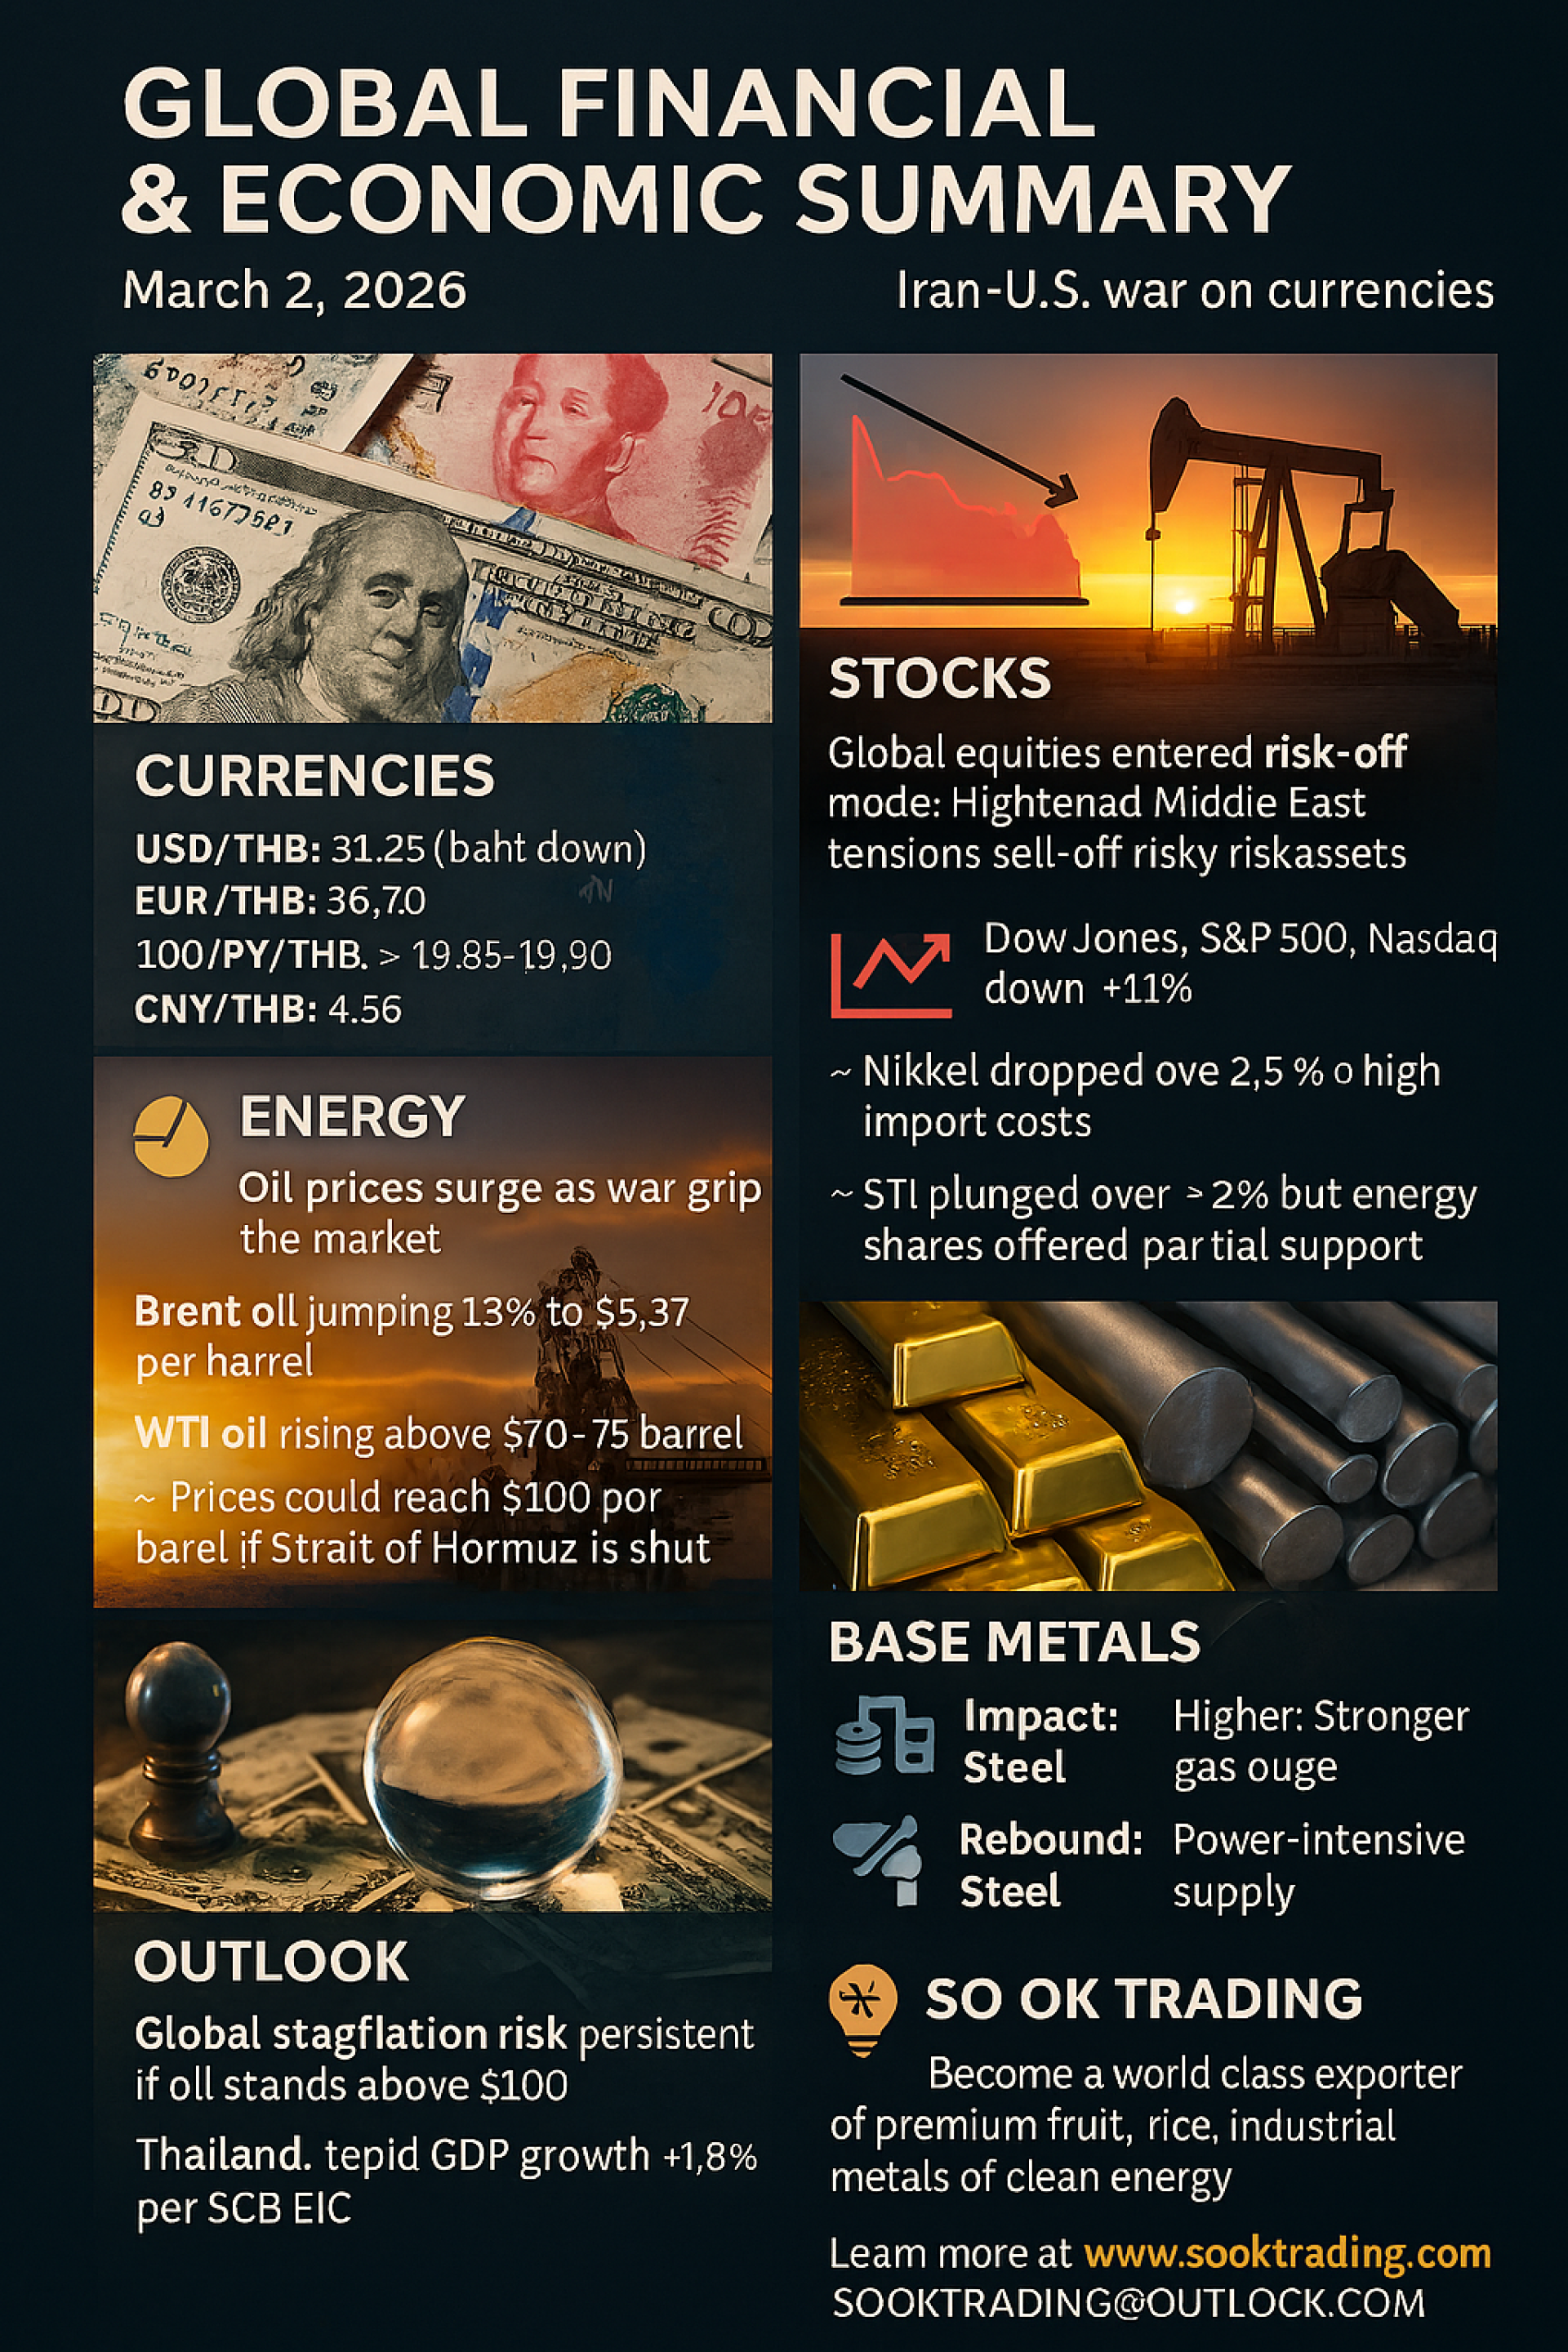
Global Financial & Economic Market Summary (March 2, 2026)

The U.S.–Iran war has shaken global markets, pushing investors into a sharp “Risk-off” mode — currencies volatile, stocks tumbling, oil surging, and gold soaring to record highs.


Thai Baht & Major Currencies

The Thai Baht (THB) opened weaker, pressured by rising oil prices and capital outflows:

USD/THB: 31.25 (Baht weaker)
EUR/THB: 36.70
JPY/THB: 100 JPY ≈ 19.85–19.90
CNY/THB: 4.56
Global currency trends:

USD: Stronger as a safe-haven, supported by net energy exports
CHF: Strongest due to neutrality status
JPY: Initially stronger, but capped by high energy import costs
EUR & GBP: Weaker on European energy crisis concerns
THB: Weaker in line with regional currencies and risk-off sentiment
CNY: Narrow range movement
 

Global Stock Markets in Risk-off Mode

Middle East tensions triggered broad sell-offs:

USA: Dow Jones, S&P 500, Nasdaq down ~1% on oil price pressure
Europe: Weak from energy crisis, defense and energy stocks provide limited support
China: Hong Kong market plunged, mainland supported by stimulus expectations
Japan: Nikkei 225 down >2.5% on rising import energy costs
Singapore: STI down ~1.7%, aviation and shipping hit hard
Thailand: SET Index down >2% to ~1,490 points, partially cushioned by energy stocks
 

⛽ Oil Prices Surge on War Fears

Brent Crude: +13% to $82.37/barrel, later eased to $79–80
WTI Crude: Surged past $70–75/barrel
Outlook: If the Strait of Hormuz is blocked, prices could hit $100/barrel
 

️ Safe-haven Assets Shine

Gold: Record highs at $5,500–6,000
U.S. Treasuries: Strong buying demand
 

⚙️ Impact on Metals & Rare Earths

Steel: Costs surged from shipping and gas prices
Aluminum: Spiked due to high electricity dependency
Copper: Supported by EV demand but pressured by rising freight costs
Rare Earths: Strategic stockpiling pushed prices higher
 

Outlook for Q2 2026

Global economy: Risk of stagflation if oil stays above $100
Thai economy: SCB EIC forecasts GDP growth only 1.8% due to high energy costs
Financial markets: Continued capital inflows into safe-haven assets
Industries: Severe cost-push inflation, especially in metals and energy sectors
 

✨ Conclusion

March 2026 marks a Shock Period for global markets. Currencies volatile, stocks plunging, oil surging, and gold soaring. Investors and businesses must adapt strategies to balance risks and opportunities. Energy, metals, and safe-haven assets are now the focal points in this crisis-driven environment.


SO OK TRADING

In a world full of uncertainty, SO OK TRADING stands as your trusted global trade partner. With expertise in deep market analysis, we empower Thai businesses to step confidently onto the global stage — exporting premium fruits, rice, industrial metals, and clean energy.

We believe that “Crisis is Opportunity”, and every change is a driving force for sustainable growth .

Contact us:
www.sooktrading.com
SOOKTRADING@OUTLOOK.COM


Related Content
SO OK TRADING – Zinc Ingot for the Future of Industry Zinc Ingot 2026 – Applications & Global Market Price Outlook High Purity Zinc SHG 99.995
SO OK TRADING – Zinc Ingot 2026 High Purity SHG Zinc Ingot that connects global industries — from infrastructure and automotive to clean energy, chemicals, and agriculture. With the latest LME price outlook for 2026, we provide the insights you need to plan your business with confidence
18 Jan 2026
SO OK INSIGHT: Global Oil Prices Plunge – When Geopolitics Reshapes the Industrial World   (27 May 2026)
SO OK INSIGHT: Global Oil Prices Plunge – Geopolitical Easing Reshapes the Energy World (27 May 2026) Article Global crude oil prices have dropped to their lowest level in five weeks. Brent crude fell below $100 per barrel, while WTI settled at $92.78 per barrel. The decline follows progress in peace talks between the United States and Iran, raising hopes for reopening the Strait of Hormuz and easing supply concerns. This adjustment reflects more than just market volatility — it highlights a geopolitical shift that directly impacts global commodities, from naphtha and petrochemicals to fertilizers and alternative energy sources. For Thailand, this situation could become a golden opportunity. Lower oil prices reduce energy costs and pave the way for economic recovery in the second half of 2026. SO OK TRADING FAST • SHARP • RELIABLE
27 May 2026
ALUMINUM PRICE TREND 2026
An analysis of the aluminum market in 2026 indicates a likely continued market deficit and upward price pressure, driven by constrained supply and resilient demand from green energy sectors. However, significant volatility is expected due to policy uncertainties and the potential for new Indonesian supply to eventually balance the market. Key Drivers and Projections for 2026 Supply Side Analysis Capacity Constraints: China's primary aluminum output is approaching its self-imposed 45 million-tonne capacity cap, limiting global supply growth. Power Challenges: Smelters outside of China face intense competition for power from energy-intensive sectors like AI data centers, which are willing to pay higher prices for long-term contracts. This has kept significant capacity offline in Europe and the US. Production Disruptions: Outages and potential shutdowns at existing smelters in Iceland and Mozambique further tighten the market. Scrap Supply Pressure: The EU's planned implementation of the Carbon Border Adjustment Mechanism (CBAM) and potential scrap export tariffs in spring 2026 are expected to impact global scrap flows, creating regional shortages and price volatility. New Capacity: Indonesia is a key source of new supply, with several projects in the pipeline. However, analysts suggest the pace of the ramp-up may be slower than expected due to infrastructure and policy challenges, meaning it is unlikely to fully offset near-term tightness. Demand Side Analysis Green Transition Demand: Demand from "green" sectors such as solar panels, new energy vehicles, and energy transition infrastructure remains strong, providing fundamental support for the market. Substitution Effect: Aluminum's wide price discount relative to copper has encouraged substitution in electrical applications, acting as a tailwind for demand and prices. Construction and Automotive: The construction and automotive industries continue to be major consumers, with growing demand for lightweight, low-carbon aluminum products. Price Forecasts and Volatility The market is expected to remain in a deficit in 2026, with estimates ranging from 200,000 to 600,000 tonnes. This structural tightness is leading most analysts to forecast sustained or rising prices. Bullish Views: Analysts at Bank of America project prices of $3,000/tonne as early as 2026. J.P. Morgan also expects prices to approach $3,000/tonne in Q1 2026. ING forecasts an average price of $2,900/tonne for the year. Bearish/Conservative Views: Goldman Sachs is an outlier, forecasting prices to decline to $2,350/tonne by Q4 2026, anticipating a market surplus later in the year. SMM forecasts a "high first, then lower" pattern, with prices finding equilibrium in the $2,700–$2,800/tonne range by year-end. Premiums: Regional premiums, particularly the US Midwest premium, are expected to remain high and volatile due to tariffs and regional supply dynamics, creating a disconnect from the LME benchmark price. In essence, 2026 is projected to be a year of high volatility where participants need to focus on scenario readiness rather than relying on a single price forecast, as geopolitical and energy policies significantly influence regional supply and costs
31 Dec 2025
This website uses cookies for best user experience, to find out more you can go to our Privacy Policy and Cookies Policy
Powered By MakeWebEasy Logo MakeWebEasy