Share

“From Negotiation to Shockwaves: The U.S.–Iran Pressure Game Shakes the Global Economy Through Energy, Capital, and Gold”

Last updated: 28 Feb 2026
113 Views

U.S.–Iran Tensions and Global Economic Impact (Late February 2026)

Article by SO OK TRADING

Political and Diplomatic Overview

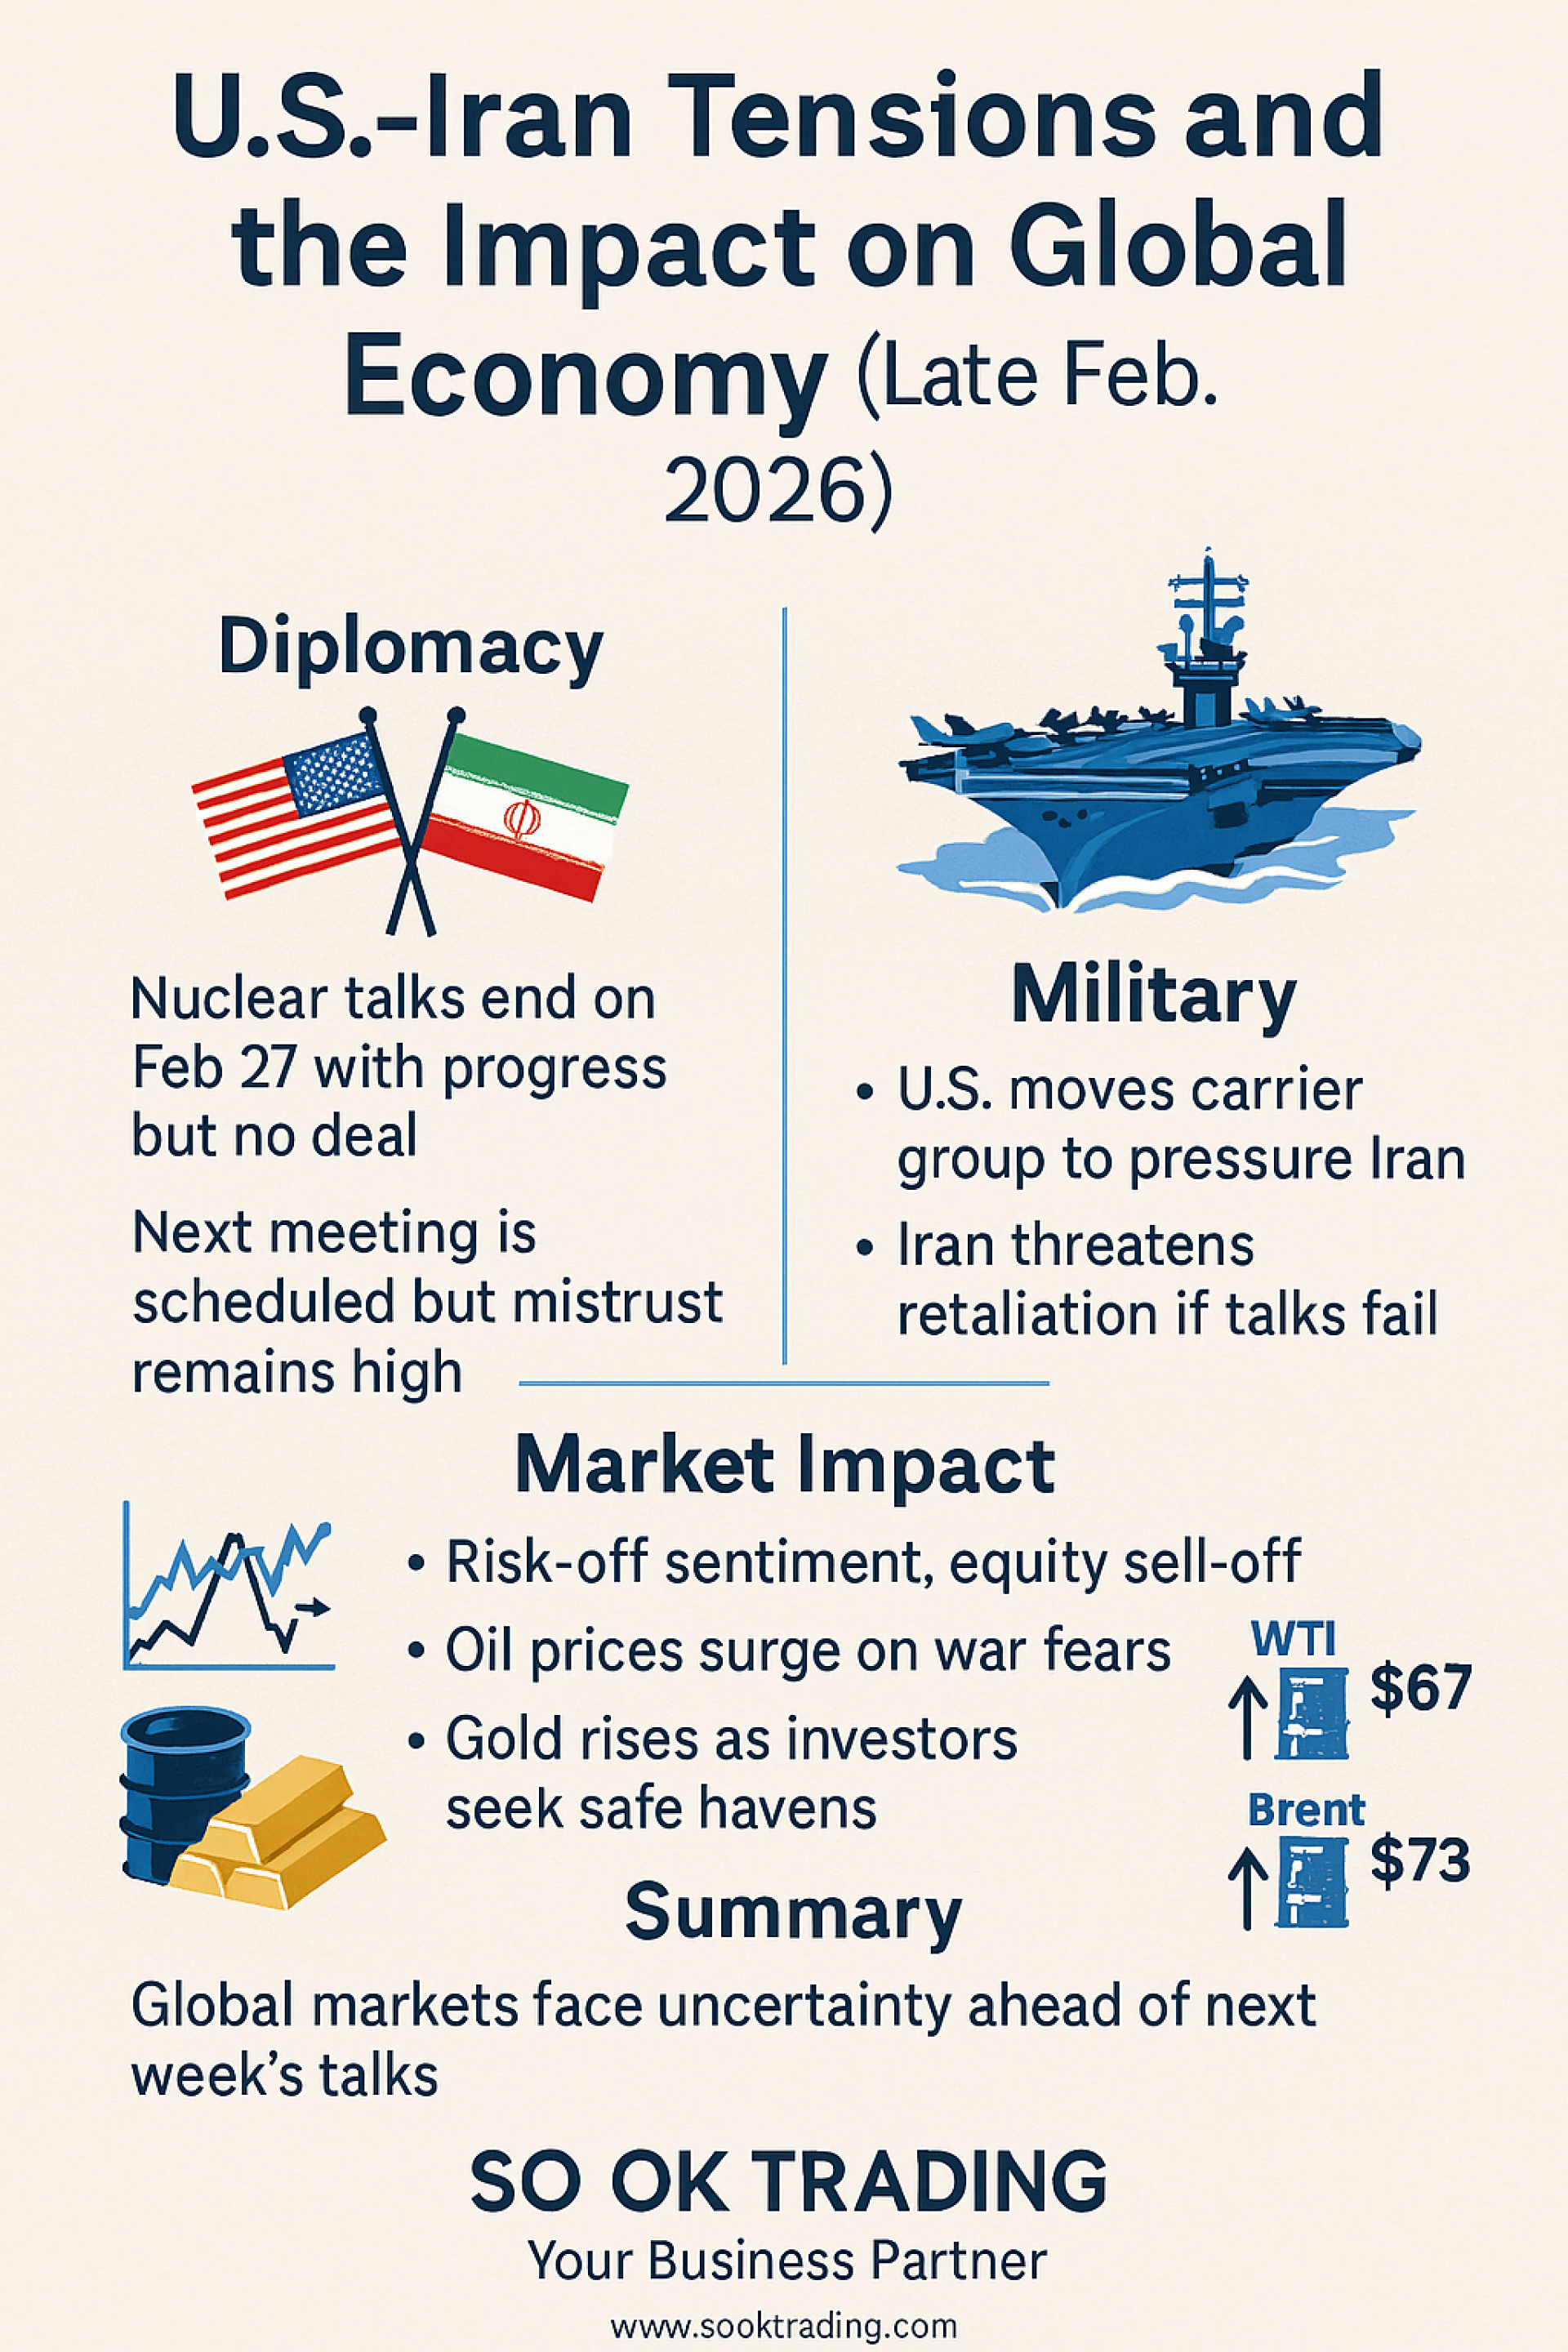
The third round of nuclear negotiations between the United States and Iran concluded on February 27. While some progress was reported, no concrete agreement was reached. Both sides plan to meet again next week, but mistrust remains high. President Donald Trump continues to pursue a “Maximum Pressure” strategy, leveraging tariffs and military pressure to push Iran toward a new deal more favorable to the U.S.

Military Tensions

The U.S. has deployed an aircraft carrier strike group and additional forces to the region, combining diplomatic pressure with a show of military strength. Israel, backed by U.S. support, has received stealth fighter jets and advanced weaponry, preparing to strike if diplomacy fails. Iran has warned it is ready to retaliate immediately, targeting U.S. bases in the region.

Impact on Global Stock Markets

The situation has triggered a clear “Risk-off” sentiment, with investors selling off risk assets.

U.S. and European markets (S&P 500, DAX) dropped sharply due to concerns over energy costs and inflation.
Emerging markets, including Thailand, suffered heavier losses as capital flowed back into U.S. safe-haven assets.
Severely impacted sectors: airlines and transportation (fuel costs), technology, and consumer goods.
Potential outperformers: energy companies (higher oil prices), defense industries (increased orders), and safe-haven assets such as gold, U.S. Treasuries, and the U.S. dollar.
Oil Prices

Oil surged on “war risk premiums.”

WTI closed at $67.02 per barrel (+2.8%).
Brent closed at $72.87 per barrel (+2.9%).
Concerns over potential disruption of shipments through the Strait of Hormuz and larger-than-expected declines in U.S. crude inventories added to market tightness. In Thailand, the Oil Fund increased subsidies to stabilize retail fuel prices and ease the burden on consumers.
Gold and Precious Metals

Gold prices spiked as investors sought safe havens.

Thai gold bars: Buy at 77,400 THB / Sell at 77,600 THB.
Gold Spot: $5,100–$5,200 per ounce.
JP Morgan raised its year-end forecast to $6,300 if conflict persists. Silver rose alongside gold but remains more volatile due to its dual role as a safe-haven asset and industrial metal. Platinum and palladium face supply shock risks if transport routes are disrupted.
Base Metals

Aluminum: $3,100–$3,200 per ton. Rising energy costs and transport risks are driving prices higher.
Copper: $13,100–$13,200 per ton. Short-term support comes from defense demand and transport costs, but long-term pressure looms if global economic growth slows.
Currency Movements

Heightened tensions pushed investors toward safe-haven currencies.

U.S. Dollar (USD): DXY at 97.7–97.8, with potential for further strengthening if tensions escalate.
Chinese Yuan (CNY): 6.85–6.86 per dollar, weakening due to higher energy costs and capital outflows.
Thai Baht (THB): 31.00–31.23 per dollar, pressured by oil imports but supported by rising gold prices. Expected to fluctuate between 31.00–31.60 next week.
 

Summary by SO OK TRADING

The U.S.–Iran situation is at its most fragile point. If next week’s negotiations fail, the risk of limited military action will rise sharply. Global markets will face extreme volatility across equities, oil, gold, and currencies. Investors must closely monitor the upcoming OPEC+ meeting and the next round of talks, as these will determine the short- to mid-term trajectory of the global economy.

SO OK TRADING — Your Business Partner
For more information or to source products for your industry, please visit www.sooktrading.com.


Related Content
ALUMINUM PRICE TREND 2026
An analysis of the aluminum market in 2026 indicates a likely continued market deficit and upward price pressure, driven by constrained supply and resilient demand from green energy sectors. However, significant volatility is expected due to policy uncertainties and the potential for new Indonesian supply to eventually balance the market. Key Drivers and Projections for 2026 Supply Side Analysis Capacity Constraints: China's primary aluminum output is approaching its self-imposed 45 million-tonne capacity cap, limiting global supply growth. Power Challenges: Smelters outside of China face intense competition for power from energy-intensive sectors like AI data centers, which are willing to pay higher prices for long-term contracts. This has kept significant capacity offline in Europe and the US. Production Disruptions: Outages and potential shutdowns at existing smelters in Iceland and Mozambique further tighten the market. Scrap Supply Pressure: The EU's planned implementation of the Carbon Border Adjustment Mechanism (CBAM) and potential scrap export tariffs in spring 2026 are expected to impact global scrap flows, creating regional shortages and price volatility. New Capacity: Indonesia is a key source of new supply, with several projects in the pipeline. However, analysts suggest the pace of the ramp-up may be slower than expected due to infrastructure and policy challenges, meaning it is unlikely to fully offset near-term tightness. Demand Side Analysis Green Transition Demand: Demand from "green" sectors such as solar panels, new energy vehicles, and energy transition infrastructure remains strong, providing fundamental support for the market. Substitution Effect: Aluminum's wide price discount relative to copper has encouraged substitution in electrical applications, acting as a tailwind for demand and prices. Construction and Automotive: The construction and automotive industries continue to be major consumers, with growing demand for lightweight, low-carbon aluminum products. Price Forecasts and Volatility The market is expected to remain in a deficit in 2026, with estimates ranging from 200,000 to 600,000 tonnes. This structural tightness is leading most analysts to forecast sustained or rising prices. Bullish Views: Analysts at Bank of America project prices of $3,000/tonne as early as 2026. J.P. Morgan also expects prices to approach $3,000/tonne in Q1 2026. ING forecasts an average price of $2,900/tonne for the year. Bearish/Conservative Views: Goldman Sachs is an outlier, forecasting prices to decline to $2,350/tonne by Q4 2026, anticipating a market surplus later in the year. SMM forecasts a "high first, then lower" pattern, with prices finding equilibrium in the $2,700–$2,800/tonne range by year-end. Premiums: Regional premiums, particularly the US Midwest premium, are expected to remain high and volatile due to tariffs and regional supply dynamics, creating a disconnect from the LME benchmark price. In essence, 2026 is projected to be a year of high volatility where participants need to focus on scenario readiness rather than relying on a single price forecast, as geopolitical and energy policies significantly influence regional supply and costs
31 Dec 2025
“CBAM & Carbon Credit: Transforming Global Trade — From Cost to Opportunity, Adapting Early with Carbon Footprint as the Survival Blueprint for Thai Businesses in the Green Era”
CBAM & Carbon Credit: A Guide for Thai Businesses to the New Global Trade Alongside “Carbon Footprint: The Blueprint for Future Business” The EU’s CBAM regulation is reshaping global trade entirely! Thai businesses—especially exporters and SMEs—must act quickly: measuring carbon emissions, adopting clean energy, and offsetting with carbon credits.
21 Feb 2026
This website uses cookies for best user experience, to find out more you can go to our Privacy Policy and Cookies Policy
Compare product
0/4
Remove all
Compare
Powered By MakeWebEasy Logo MakeWebEasy