Silver Market After Chinese New Year: Correction Is Not the End — Silver 2026: From Sharp Drop to Base Building and Rebound — From $114 to $73, the Pause Before the Next Rally
Silver Market Overview After Chinese New Year 2026
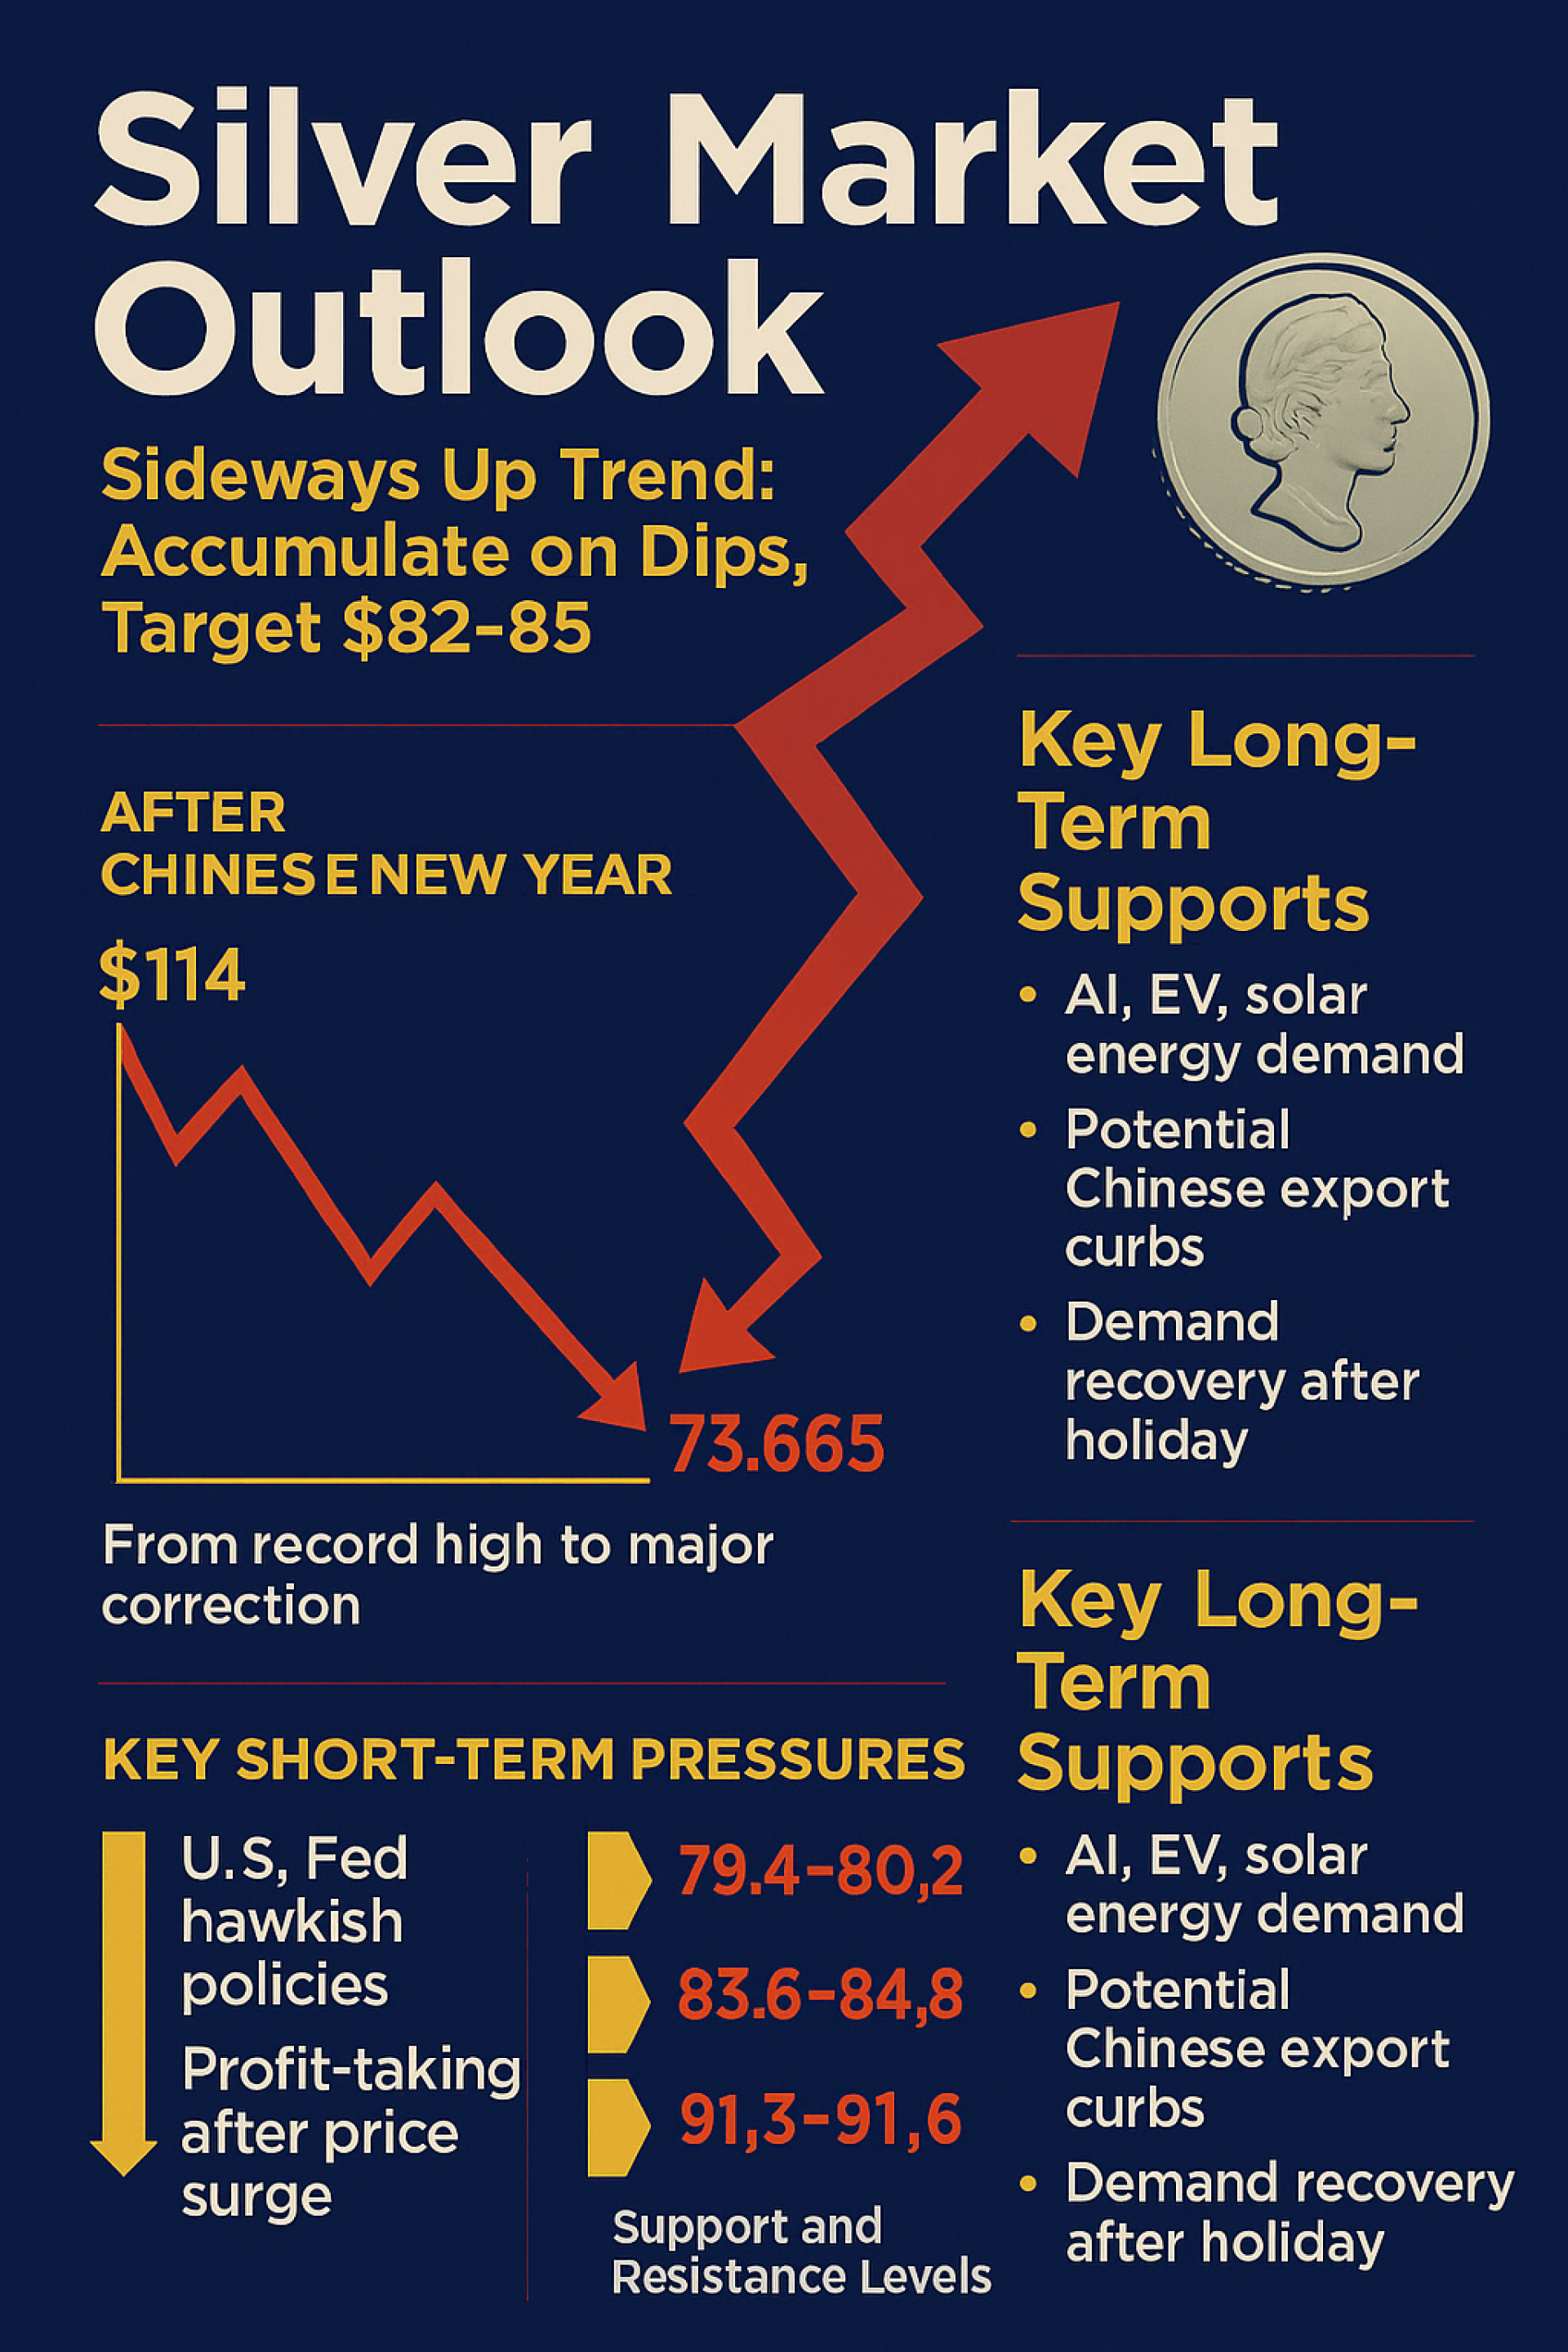
At the beginning of 2026, silver became the “star” of the precious metals market, surging to a new historical high of $114/oz at the end of January. Shortly afterward, prices entered a major correction, with the latest level at $73.65/oz (Feb 17, 2026). This sharp decline reflects the fading of speculative momentum beyond fundamentals, and the market is now entering a phase of base building.
Silver Price Analysis — Short-Term Pressures
U.S. Monetary Policy (Fed Hawkish)
The appointment of a new Fed Chair with a hawkish stance reinforces expectations of prolonged high interest rates. A stronger dollar continues to pressure gold and silver prices.
Profit Taking
After the sharp rally, institutional investors closed long positions, triggering continuous selling and steep price declines.
Liquidity Drain in Asia
The Chinese market closure during Lunar New Year reduced buying support. Low liquidity meant even small sell orders had outsized impact.
Margin Calls & Forced Selling
CME raised margin requirements for silver trading. Highly leveraged investors faced forced liquidations, accelerating the downturn.
Silver Price Analysis — Long-Term Supports
Despite short-term volatility, silver retains strong long-term drivers:
Rising demand in AI, EV, and solar energy industries
Potential Chinese export restrictions to prioritize domestic use
Recovery of physical demand post–Chinese New Year as factories resume full operations
Silver Price Analysis — Key Support & Resistance Levels (USD/oz)
Support
$74–75 → Current level the market is trying to defend
$71–72.8 → Early-year low; breaking below could trigger panic selling
$64–68 → Major buy zone for long-term accumulation
Resistance
$79.4–80.2 → Psychological barrier; breakout would confirm end of sell-off
$83.6–84.8 → Former support turned resistance
$91.3–91.6 → Next target if full uptrend resumes
Silver Price Analysis — Investment Strategies
Short-Term: Market remains bearish. If price fails to hold above $79.5, set Stop Loss at $71.
Medium-Term: Holding above $75 opens the path to test $82.5–85 by late March.
Long-Term: Use the correction phase to accumulate gradually (DCA). Avoid high leverage, as silver is 2–3 times more volatile than gold.
Silver Price Analysis — Q1 2026 Outlook
Late February: Expected sideways trading in the $72–78 range to ease selling pressure.
Late March: If price holds above $75, potential to test $82.5–85. A return to $100 within March remains unlikely.
Overall: Market entering a sideways uptrend — gradual recovery, but less explosive than January’s rally.
Silver Market Summary After Chinese New Year 2026
Silver is now in a base-building phase awaiting recovery.
Investors should avoid chasing prices and instead accumulate on dips.
Core strategy: long-term accumulation, Stop Loss at $71, partial profit-taking when price reaches $82.5–88.
Conclusion from SO OK TRADING
The 2026 silver market has entered a crucial consolidation after January’s surge. This correction is not the end, but rather a pause before the next rally. Demand from technology and clean energy industries remains the key long-term driver supporting silver prices.